Question 1:
The range of years in gapminder is 1952-2007. To find this, use the code:
print(range(gapminder$year))
Question 2:
gapminder %>%
    print(n = 20) %>%
summary()This statement can be recreated in base R using the following line:
summary(print(gapminder, n=20))
Question 3:
To find the average life expectancy, we must first filter to only the last year of the data set, 2007. We can then group by continent, and then use the summarise function to find the average life expectancy using the base R function weighted.mean:
weighted_life_exp <- gapminder %>%
  filter(year==2007) %>%
  group_by(continent) %>%
  summarise(avg_life_Exp=weighted.mean(lifeExp,pop))
Question 4:
We first filter the data set to only include China. We then use select() to extract only the year and lifeExp columns. This is then put in to ggplot() to create a plot of life expectancy over time.
china_life_exp <- gapminder %>%
  filter(country=='China') %>%
  select(lifeExp, year)

ch_life_exp_time <- ggplot(china_life_exp, aes(year,lifeExp)) +
  geom_point() +
  labs(x='Year', y='Life Expecancy (yrs)', title='Life Expectancy in China') +
  theme_bw()
Extra Credit Pipeline:
Summarise to find the maximum population of each country:
max_pop <- gapminder %>%
  group_by(country) %>%
  summarise(maxpop=max(pop))
Plotting Challenge:
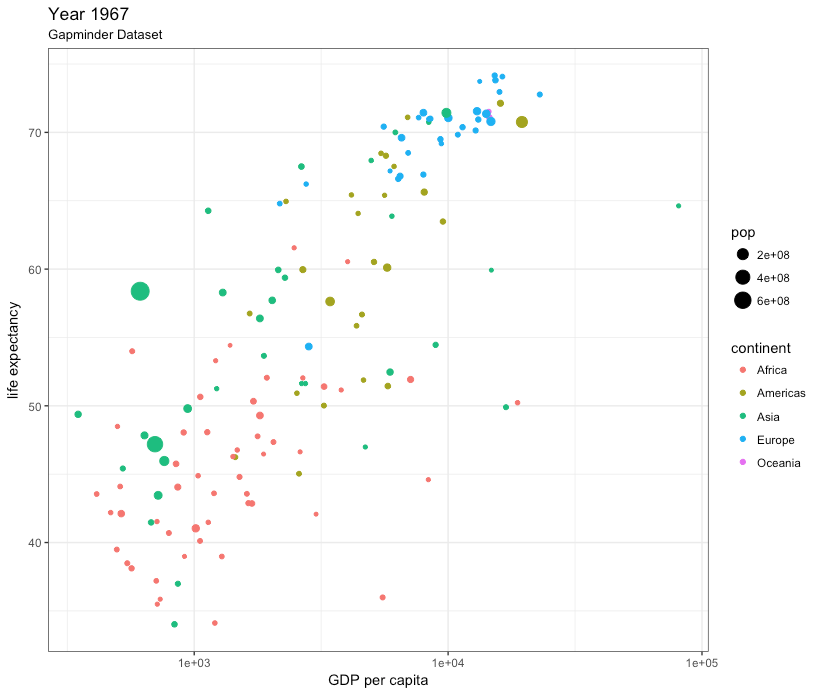
The plot is filtered to the year 1967, with gdpPercap on the x axis and lifeExp on the y axis. The x-axis is on a logarithmic scale. The points are colored by continent and sized by population.
plot_recreate <- gapminder %>%
  filter(year==1967) %>%
  ggplot(aes(gdpPercap,lifeExp,color=continent,size=pop)) +
  geom_point() +
  scale_x_log10() +
  labs(x='GDP per capita', y='life expectancy', title='Year 1967', subtitle='Gapminder Dataset') +
  theme_bw()


Please post your answers in one comment below. And do take advantage of the formatting tools available when writing comments (https://help.github.com/en/articles/basic-writing-and-formatting-syntax) for readability. Have fun and slack us on the #suli-rstats channel if you need help!
Packages Needed:
dplyrtidyrggplot2gapminder- data package of life expectancy, GDP per capita, and population for 142 countriesQuestion 1:
What is the range (hint, hint) of the years in this dataset?
Question 2:
How would you do this in base R (without pipelines)? Think about how functions are structured (function(argument))
Question 3:
Write a pipeline that prints the average life expectancy for each continent in the last year of the dataset. Note that to do this correctly, you’ll need to weight by country populations. Paste the tibble/dataframe, also note you can use ``` on either side of text to format code in a comment.
Question 4:
Write a pipeline that picks out China and returns only the
yearandlifeExpcolumns and plot the life expectancy over time. Check out theselect()function in dplyr.Extra Credit Pipeline:
Write a pipeline that computes the year of max population for each country.
Plotting Challenge:
Using the full
gapminderdataset, reproduce this plot. Note: the x-axis looks like it's been scaled.Hint: First look at what data is being shown. Has it been filtered? What variables are plotted and how?