 scovitz
commented
1 year ago
scovitz
commented
1 year ago roadmap
Open scovitz opened 2 years ago
scovitz
commented
1 year ago roadmap
 tsalo
commented
7 months ago
tsalo
commented
7 months ago Does anyone have a sense of what these plots would look like? @mattcieslak?
 Remi-Gau
commented
7 months ago
Remi-Gau
commented
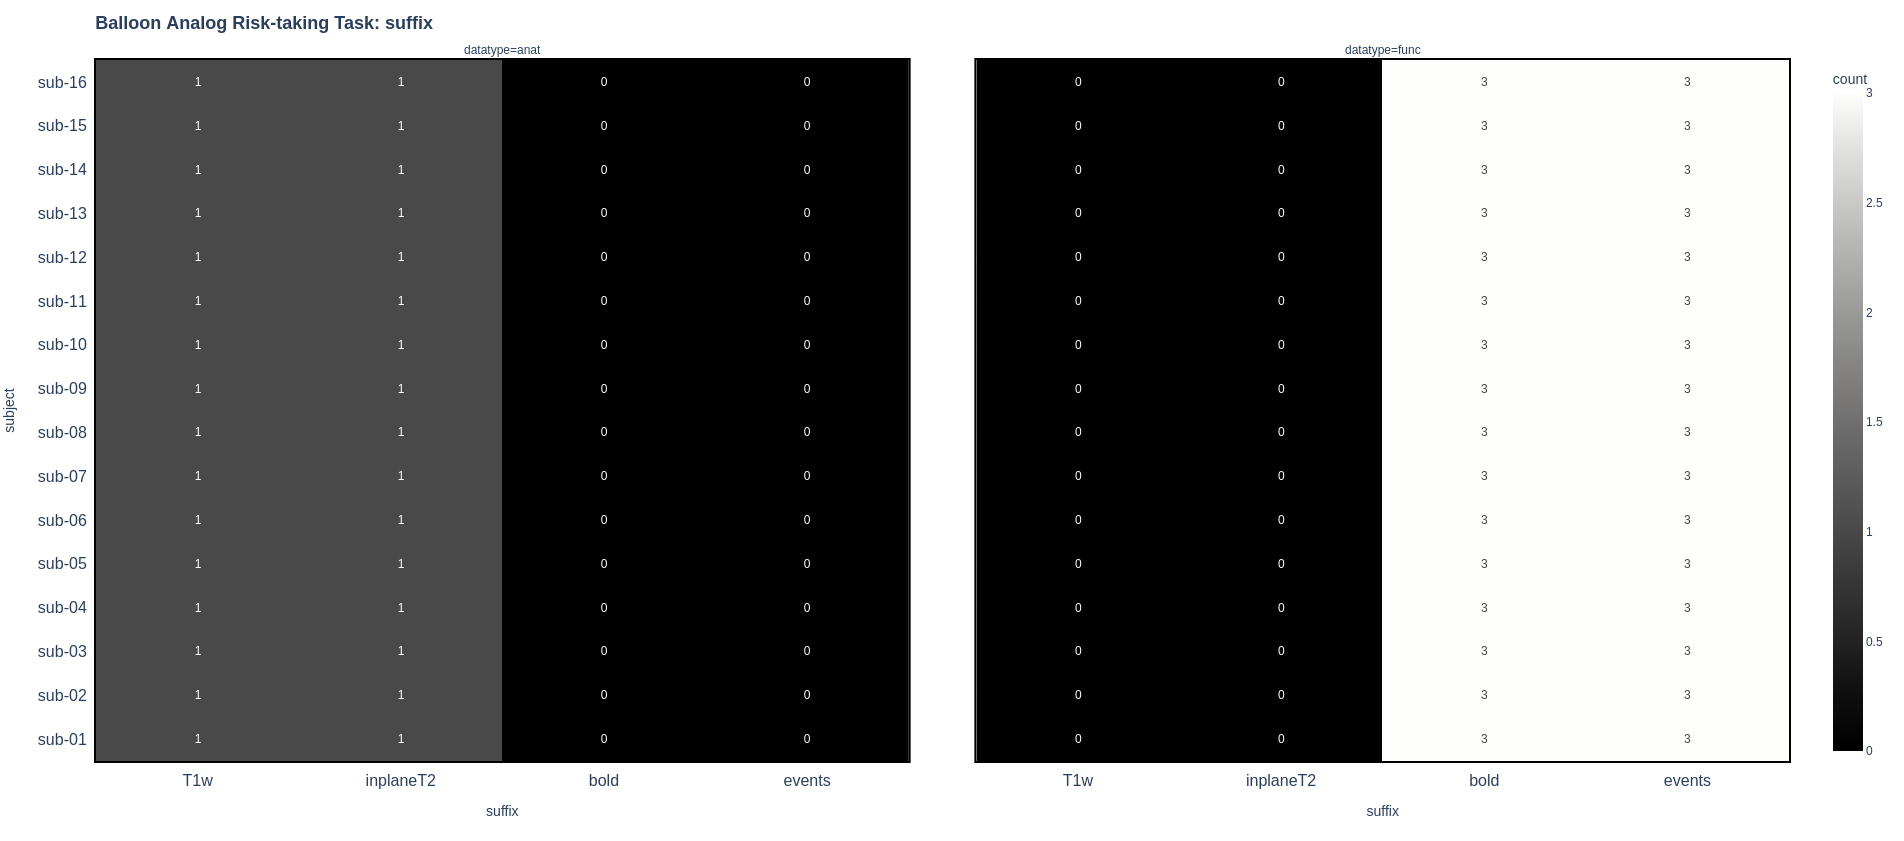
7 months ago Not sure if related but back in the days I was trying to create some summary figures of BIDS dataset contents:
I started a bids app for that but it is dormant for now:
https://github.com/Remi-Gau/bidsgnostic https://bidsgnostic.readthedocs.io/en/latest/
tsalo
commented
7 months ago Ohhhh thanks @Remi-Gau! That kind of reminds me of figures from missingno, which I quite like.
BTW the events file figure in the bidsgnostic documentation is beautiful!
 mattcieslak
commented
7 months ago
mattcieslak
commented
7 months ago I think the original idea was to have a few plots in a dashboard-style html page. Some example plots would be:
This wasn't fully thought out, but there are probably some other useful visualizations.
Remi-Gau
commented
7 months ago Ohhhh thanks @Remi-Gau! That kind of reminds me of figures from
missingno, which I quite like.
I did not know missingno: should probably have used that
BTW the events file figure in the bidsgnostic documentation is beautiful!
thanks!!!
my thought was to actually maybe have another pybids extension like pybids-reports that would be independent of the bids app bidsgnostic.
if that could be useful for you, I could extract it into a separate package.
tsalo
commented
7 months ago @mattcieslak I like the idea of bar plots- especially if we could use something like bokeh to show the filename patterns associated with each acquisition group in a popup.
@Remi-Gau a pybids extension might be the way to go for the basic plots. That way CuBIDS could just include it as a dependency and focus its efforts on the curation steps.
use matplotlib/seaborn (see Brainhack tutorial)