issues
search
Purdue-ACM-SIGAPP
/
Purdue-CoRec-Monitor
An app for monitoring the status and capacity of the Purdue CoRec
GNU General Public License v3.0
4
stars
0
forks
source link
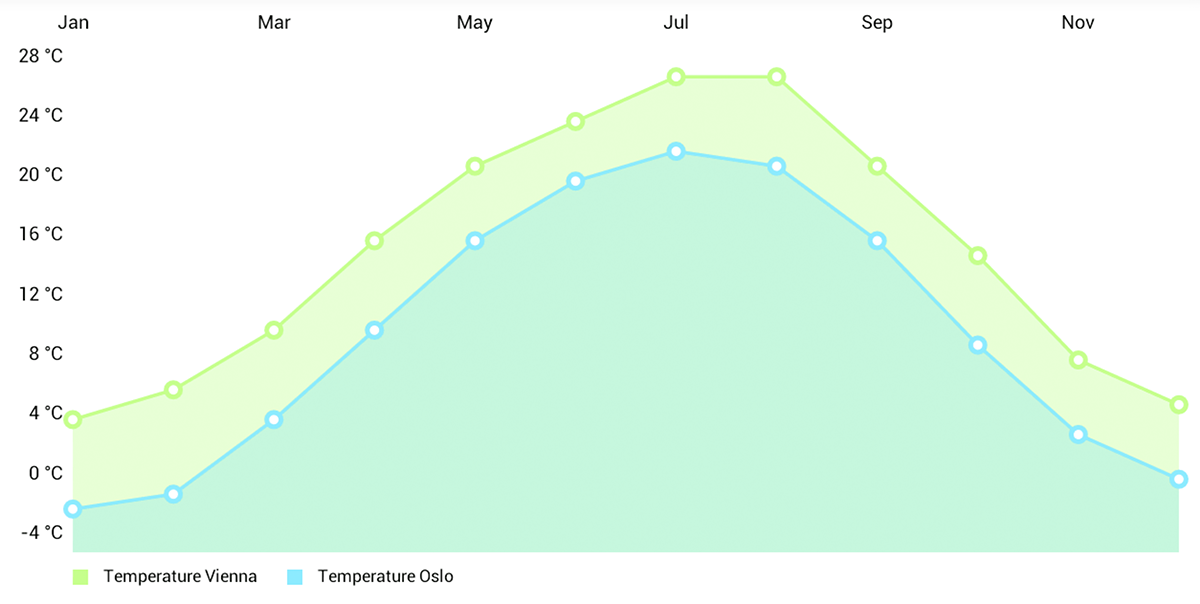
Create a stacked line graph on the monthly screen.
#5
Closed
vieck
closed
6 years ago
vieck
commented
7 years ago
This will take up the entire screen.
The line chart will show actual visitors over capacity for every day of the month.
Line Chart
For code look here:
https://github.com/PhilJay/MPAndroidChart/blob/master/MPChartExample/src/com/xxmassdeveloper/mpchartexample/MultiLineChartActivity.java
Wiki Page:
https://github.com/PhilJay/MPAndroidChart/wiki/The-ValueFormatter-interface
Line Chart