Validator Report
I am the Validator. Download all artifacts here. I'll be back and edit this comment for each new commit.
:warning: Config changes detected!
Results may differ due to these changes: ```diff diff --git a/config/config.yaml b/config/config.yaml index 75904f6..ae5e7cb 100644 --- a/config/config.yaml +++ b/config/config.yaml @@ -4,7 +4,7 @@ # docs in https://pypsa-eur.readthedocs.io/en/latest/configuration.html#run run: - prefix: 20241007_merge_master + prefix: 241008_offshore_nep name: # - CurrentPolicies - KN2045_Bal_v4 @@ -435,8 +435,8 @@ solving: offwind: DE: 2020: 7.8 - 2025: 8 - 2030: 30 + 2025: 11.3 + 2030: 30.4 2035: 70 2040: 70 2045: 70 @@ -635,3 +635,9 @@ transmission_projects: onshore_nep_force: cutin_year: 2020 cutout_year: 2030 + +#beware - may need to increase max offshore +#to avoid infeasibilities +offshore_nep_force: + cutin_year: 2025 + cutout_year: 2030 ```Ariadne Variables
Comparison
| NRMSE | Pearson | |
|---|---|---|
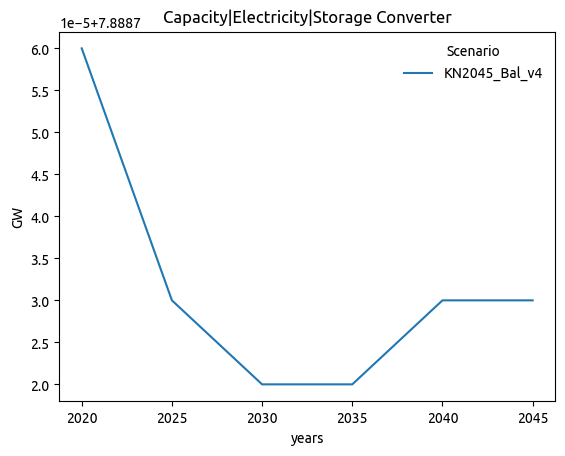
| Capacity|Electricity|Storage Converter | 0.540 | 0.016 |
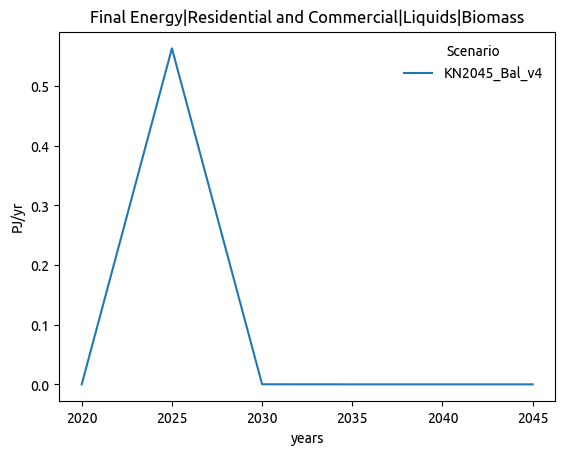
| Final Energy|Residential and Commercial|Liquids|Biomass | 0.408 | 0.000 |
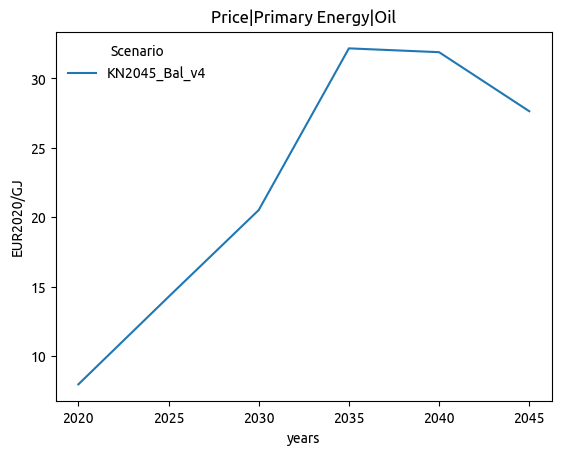
| Price|Primary Energy|Oil | 0.350 | 0.000 |
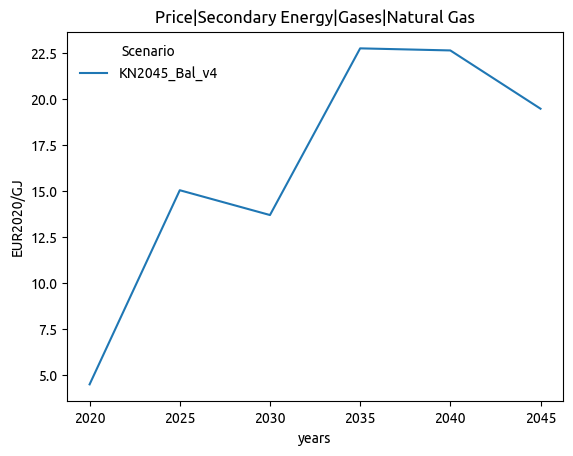
| Price|Secondary Energy|Gases|Natural Gas | 0.349 | 0.000 |
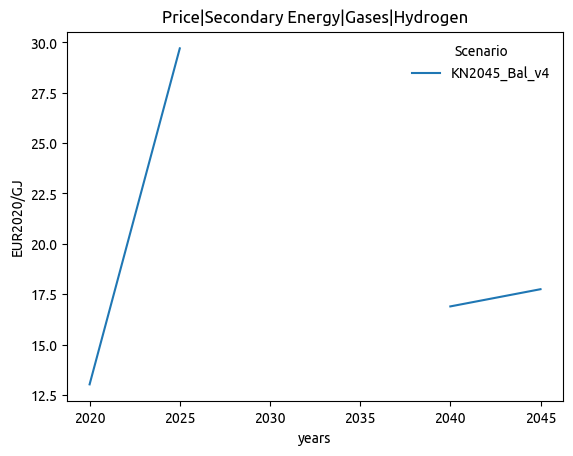
| Price|Secondary Energy|Gases|Hydrogen | 0.345 | 0.000 |
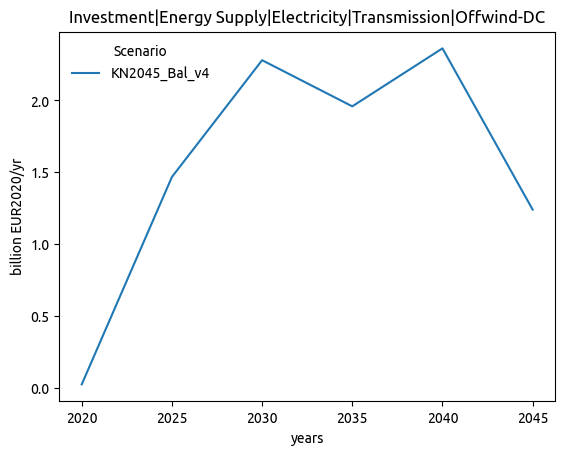
| Investment|Energy Supply|Electricity|Transmission|Offwind-DC | 0.281 | 0.617 |
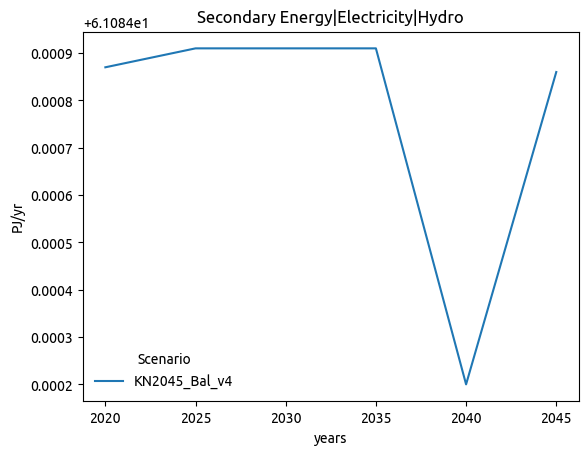
| Secondary Energy|Electricity|Hydro | 0.281 | 0.975 |
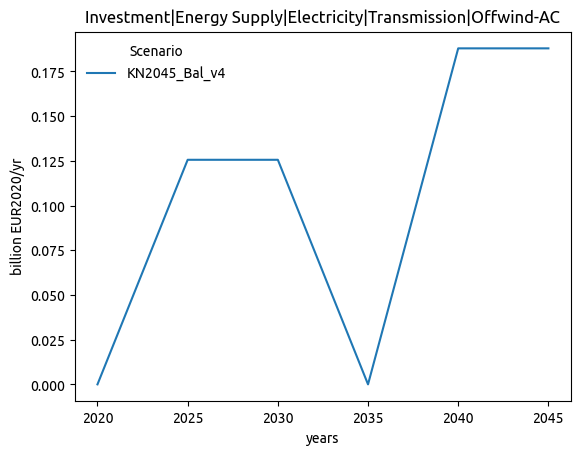
| Investment|Energy Supply|Electricity|Transmission|Offwind-AC | 0.275 | 0.778 |
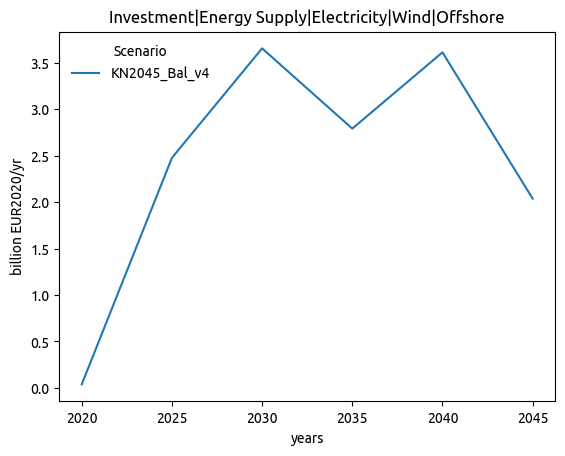
| Investment|Energy Supply|Electricity|Wind|Offshore | 0.215 | 0.765 |
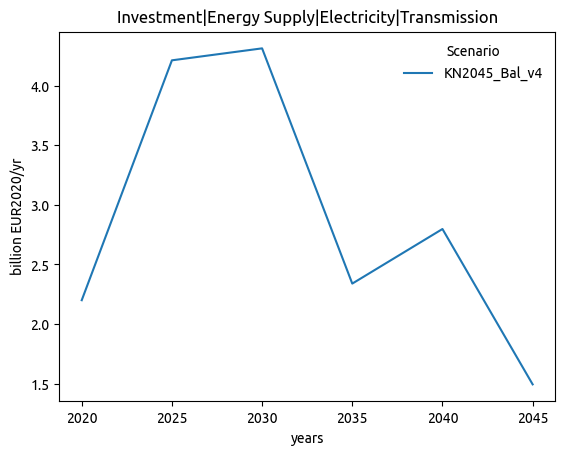
| Investment|Energy Supply|Electricity|Transmission | 0.201 | 0.942 |
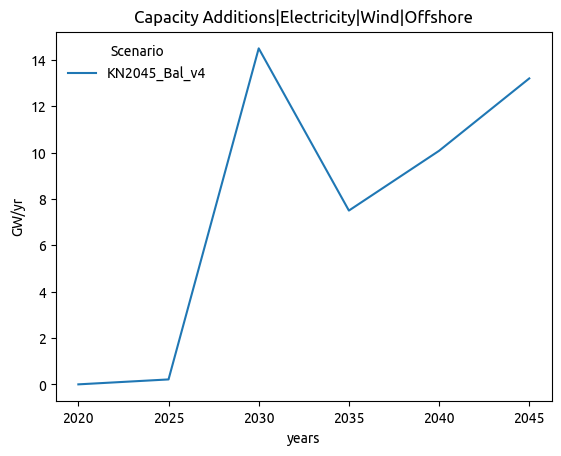
| Capacity Additions|Electricity|Wind|Offshore | 0.201 | 0.841 |
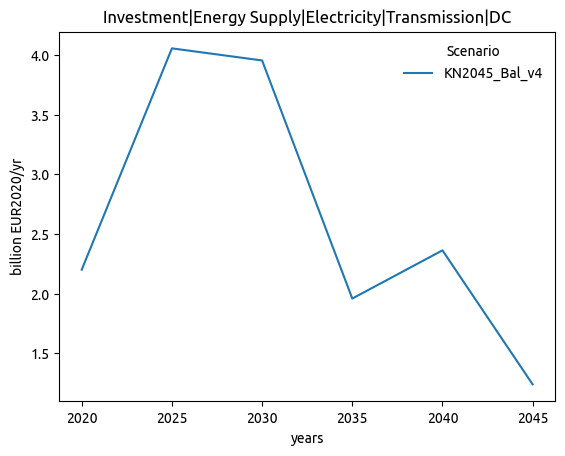
| Investment|Energy Supply|Electricity|Transmission|DC | 0.195 | 0.955 |
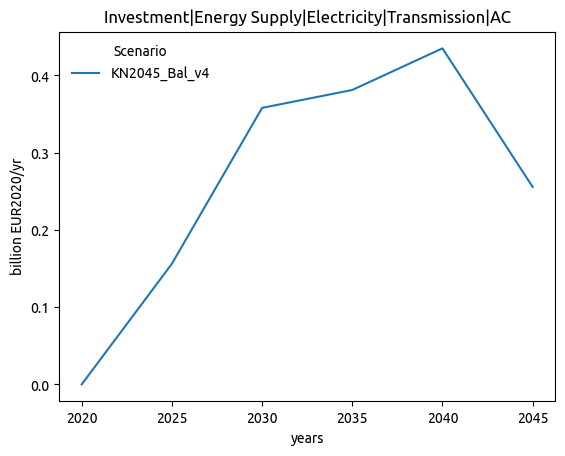
| Investment|Energy Supply|Electricity|Transmission|AC | 0.122 | 0.931 |
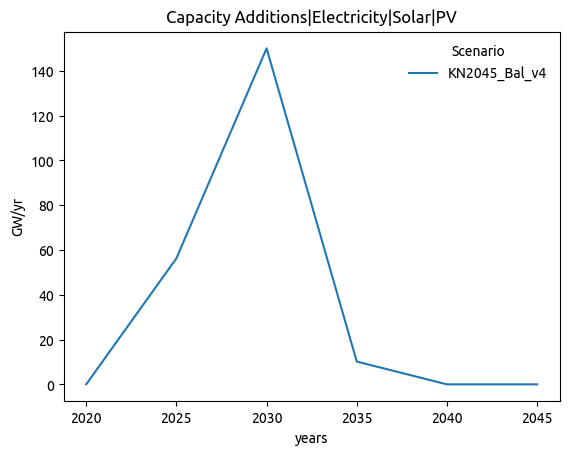
| Capacity Additions|Electricity|Solar|PV | 0.108 | 0.969 |
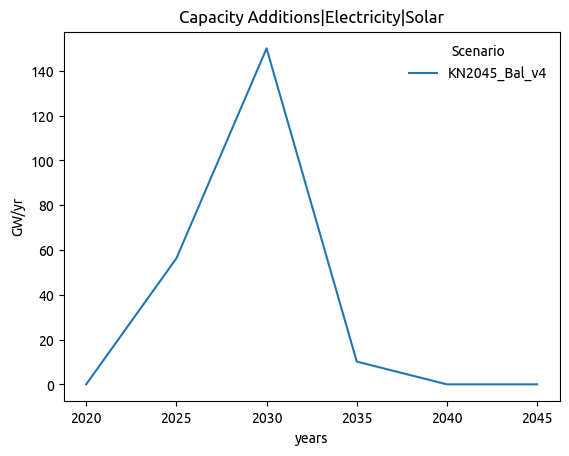
| Capacity Additions|Electricity|Solar | 0.108 | 0.969 |
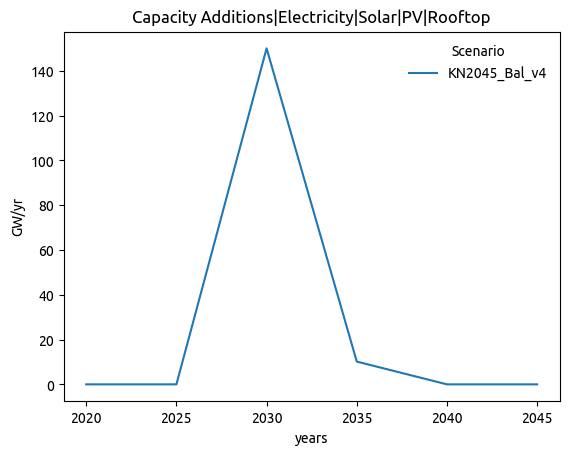
| Capacity Additions|Electricity|Solar|PV|Rooftop | 0.108 | 0.969 |
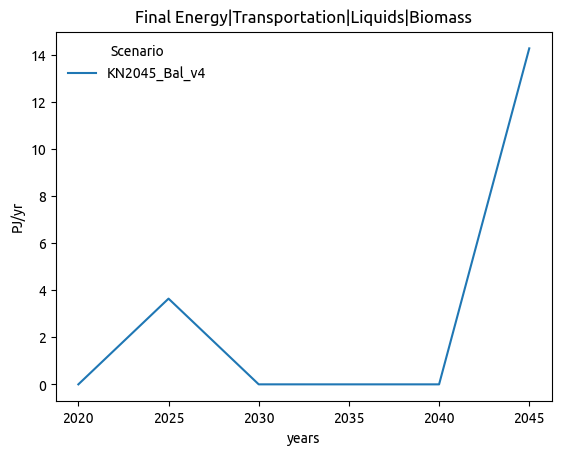
| Final Energy|Transportation|Liquids|Biomass | 0.104 | 0.967 |
Plots
| Main branch | Feature branch |
|---|---|
 |
 |
 |
 |
 |
 |
 |
 |
 |
 |
 |
 |
 |
 |
 |
 |
 |
 |
 |
 |
 |
 |
 |
 |
 |
 |
 |
 |
 |
 |
 |
 |
 |
 |
General
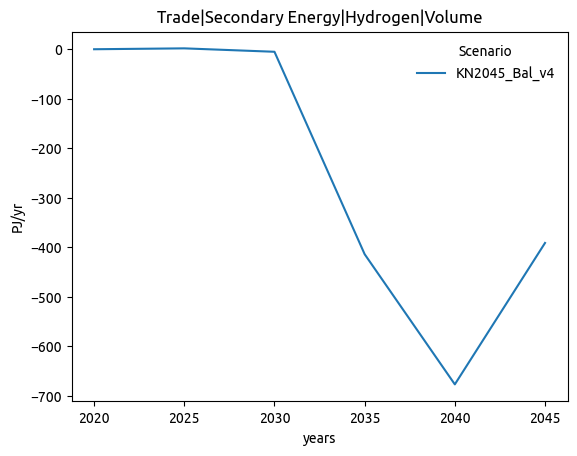
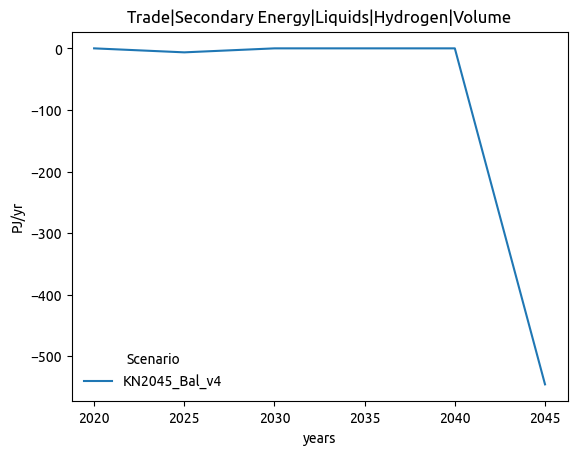
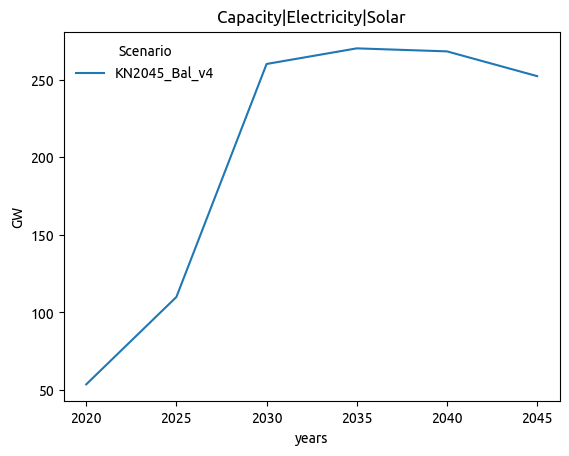
Plots comparison
| Main branch | Feature branch |
|---|---|
 |
 |
 |
 |
 |
 |
 |
 |
 |
 |
 |
 |
Files comparison
| Status | NRMSE | MAE (norm) | |
|---|---|---|---|
| csvs/market_values.csv | :warning:Changed | 0.022 | 0.05 |
| csvs/curtailment.csv | :warning:Changed | 0.000 | 0.11 |
| csvs/price_statistics.csv | :warning:Changed | 0.009 | 0.24 |
| csvs/cumulative_cost.csv | :warning:Changed | 0.001 | 0.13 |
| csvs/metrics.csv | :warning:Changed | 0.001 | 0.09 |
| csvs/nodal_cfs.csv | :warning: NaN mismatch | ||
| csvs/nodal_capacities.csv | :warning: NaN mismatch | ||
| csvs/nodal_supply_energy.csv | :warning: NaN mismatch | ||
| csvs/nodal_costs.csv | :warning: NaN mismatch | ||
| csvs/capacities.csv | :white_check_mark: Almost equal | 0.000 | 0.00 |
| csvs/supply.csv | :white_check_mark: Almost equal | 0.002 | 0.01 |
| csvs/prices.csv | :white_check_mark: Almost equal | 0.002 | 0.00 |
| csvs/cfs.csv | :white_check_mark: Almost equal | 0.039 | 0.00 |
| csvs/costs.csv | :white_check_mark: Almost equal | 0.001 | 0.01 |
| csvs/supply_energy.csv | :white_check_mark: Almost equal | 0.000 | 0.03 |
| csvs/energy.csv | :white_check_mark: Almost equal | 0.000 | 0.02 |
| csvs/weighted_prices.csv | :white_check_mark: Equal |
Model Metrics
Benchmarks
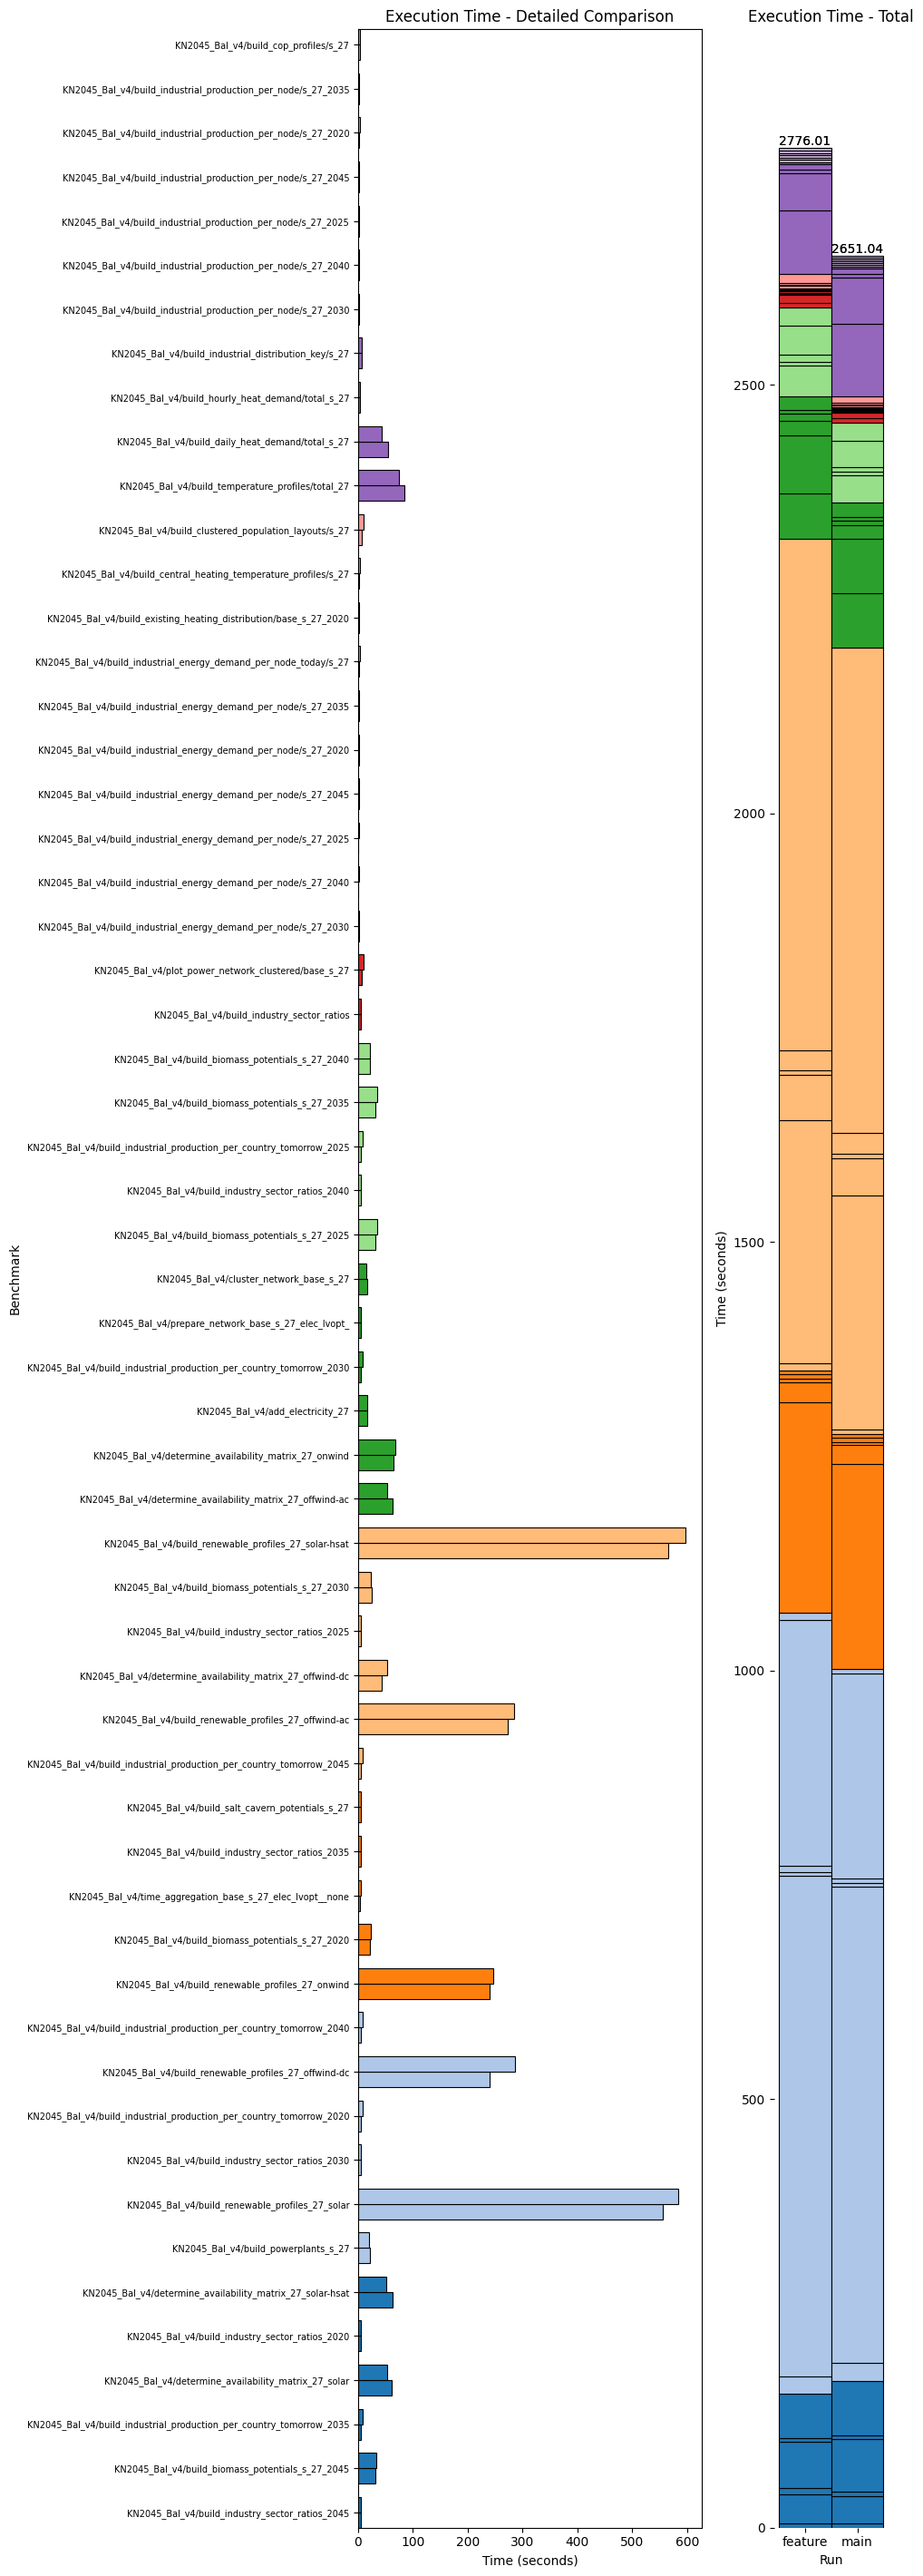

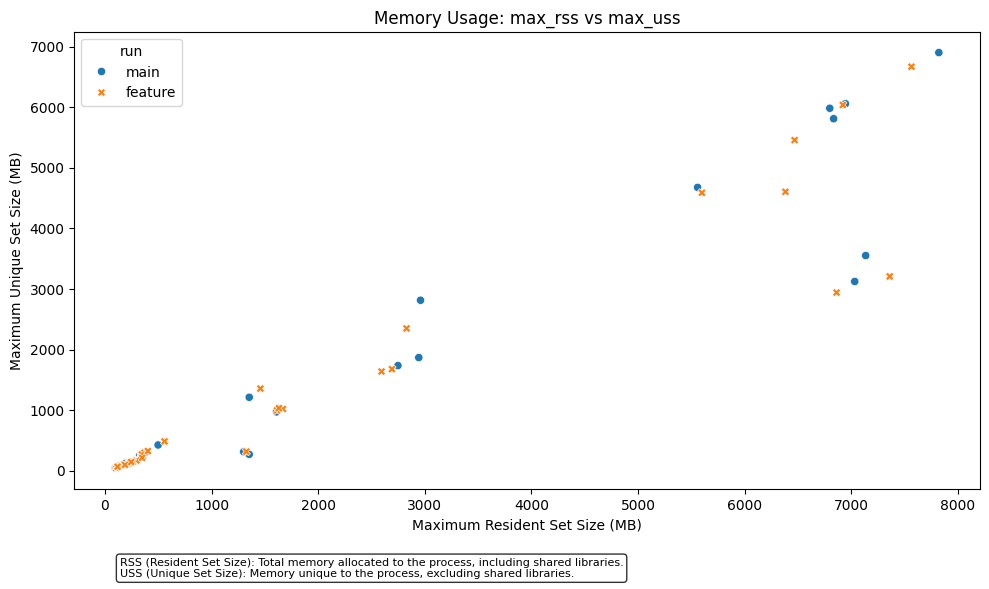
Comparing offshore-nvp (cf8b978) with main (fa953d6).
Branch is 15 commits ahead and 0 commits behind.
Last updated on 2024-10-09 15:53:26 CEST.
Projects for offshore wind connection in the North and Baltic Seas are read in and then (in a configurable way) forced into the network with the correction connection point. The default is only to do this for the projects planned until 2030, which mostly already have final investment decisions.
Beware: you may have to adjust the max capacity limits to avoid infeasibilities from forcing in the offshore capacity.
Beware: the connection costs of these forced projects are not calculated yet, or accounted for in the Ariadne database export.
This code was tested with 27 and 49 nodes.
Before asking for a review for this PR make sure to complete the following checklist:
ariadne_allcompletes without errorsexport_ariadne_variableshas been adapted to the changesChangelog.mdmainhas been merged into the PRYYYYMMDDdescriptive_title