Validator Report
I am the Validator. Download all artifacts here. I'll be back and edit this comment for each new commit.
:warning: Config changes detected!
Results may differ due to these changes: ```diff diff --git a/config/config.yaml b/config/config.yaml index 9d53517..e05cf06 100644 --- a/config/config.yaml +++ b/config/config.yaml @@ -234,7 +234,7 @@ clustering: # docs in https://pypsa-eur.readthedocs.io/en/latest/configuration.html#co2-budget co2_budget: 2020: 0.800 # 20% reduction by 2020 - 2025: 0.600 + 2025: 0.620 2030: 0.450 # 55% reduction by 2030 (Ff55) 2035: 0.250 2040: 0.100 # goal to be set next year @@ -426,7 +426,7 @@ solving: DE: 2020: 54.5 2025: 69 - 2030: 250 + 2030: 157 # EEG2023 Ziel für 2035 2035: 250 2040: 250 2045: 250 @@ -442,7 +442,7 @@ solving: DE: 2020: 53.7 2025: 110 # EEG2023; assumes for 2026: 128 GW, assuming a fair share reached by end of 2025 - 2030: 400 + 2030: 309 # EEG2023 Ziel für 2035 2035: 1000 2040: 1000 2045: 1000 @@ -459,16 +459,16 @@ solving: Generator: onwind: DE: - 2030: 115 # Wind-an-Land Law - 2035: 115 # Wind-an-Land Law + 2030: 99 # Wind-an-Land Law 2028 + 2035: 115 # Wind-an-Land Law 2030 2040: 115 # Wind-an-Land Law 2045: 115 offwind: DE: - 2030: 30 # Wind-auf-See Law + 2030: 22.5 # 75% Wind-auf-See Law 2035: 30 - 2040: 30 - 2045: 30 + 2040: 40 + 2045: 50 solar: DE: # EEG2023; Ziel for 2024: 88 GW and for 2026: 128 GW, ```Ariadne Variables
Comparison
| NRMSE | Pearson | |
|---|---|---|
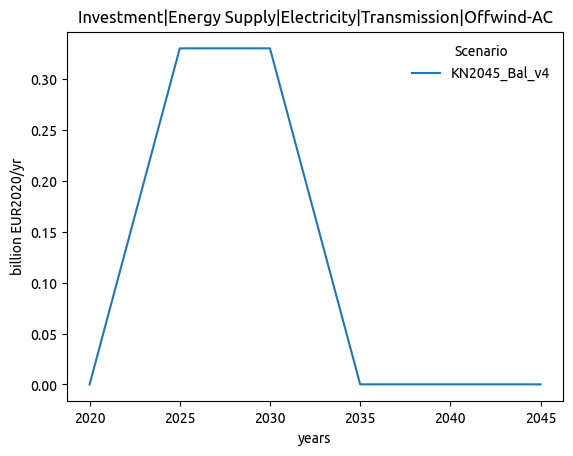
| Investment|Energy Supply|Electricity|Transmission|Offwind-AC | 0.667 | -0.500 |
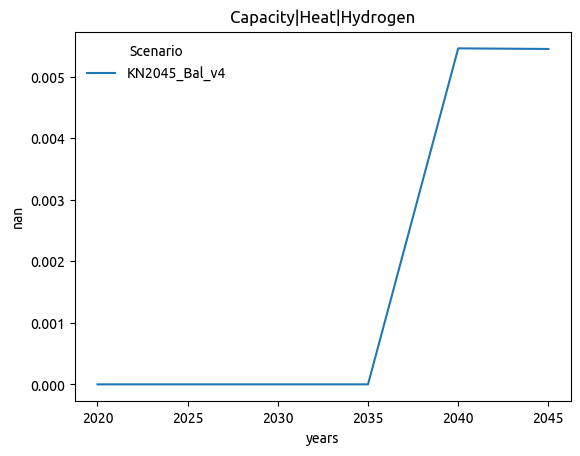
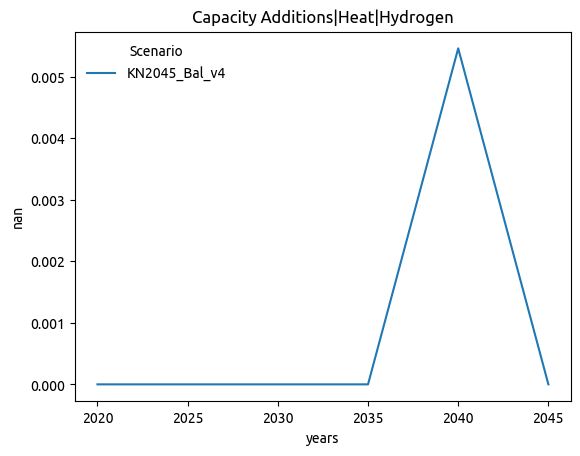
| Capacity|Heat|Hydrogen | 0.574 | 0.633 |
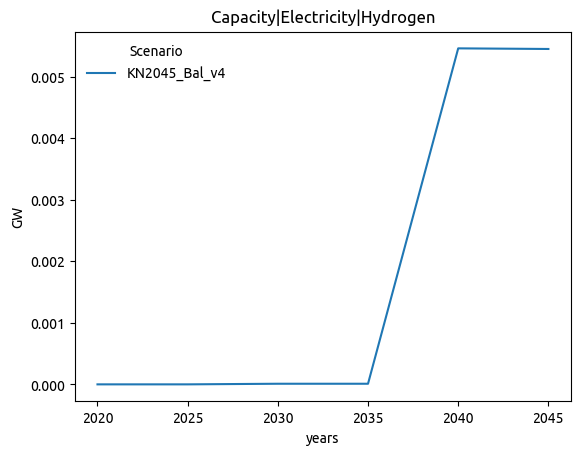
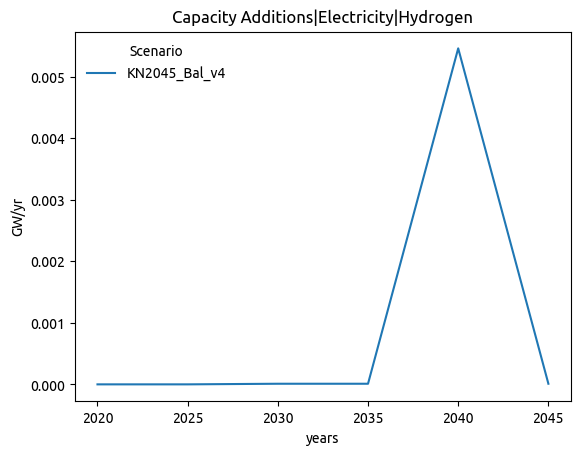
| Capacity|Electricity|Hydrogen | 0.574 | 0.592 |
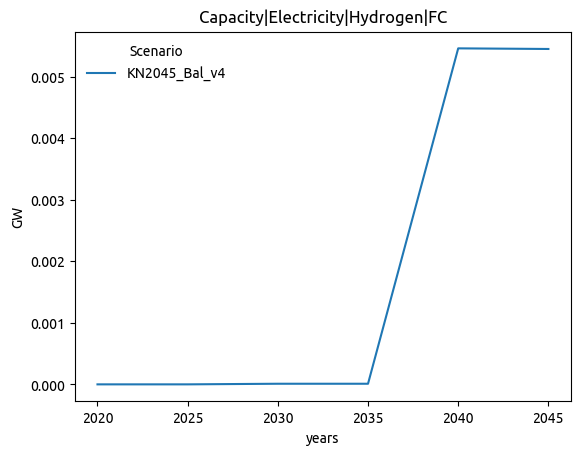
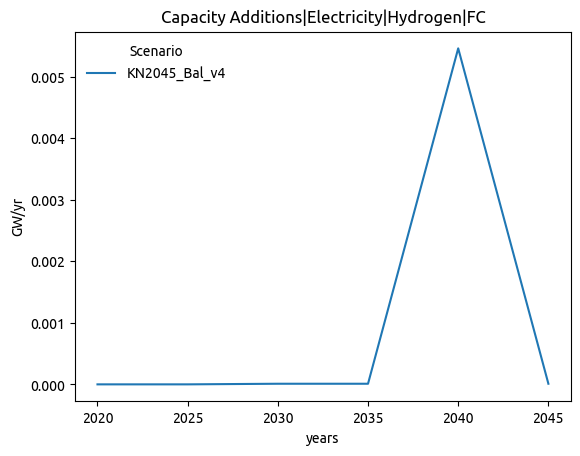
| Capacity|Electricity|Hydrogen|FC | 0.574 | 0.592 |
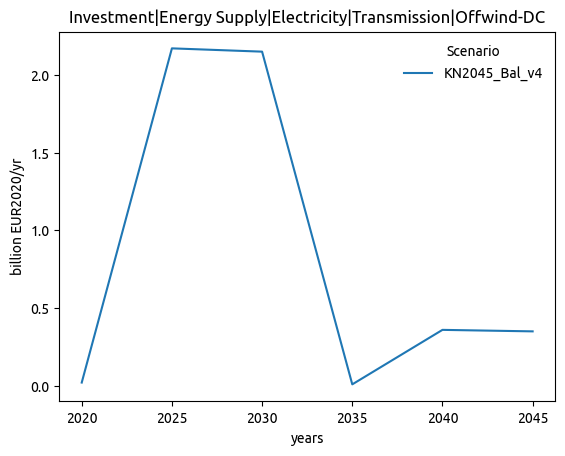
| Investment|Energy Supply|Electricity|Transmission|Offwind-DC | 0.525 | 0.374 |
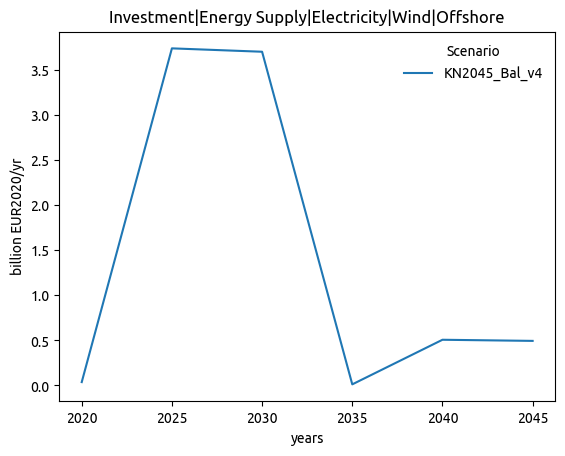
| Investment|Energy Supply|Electricity|Wind|Offshore | 0.506 | 0.415 |
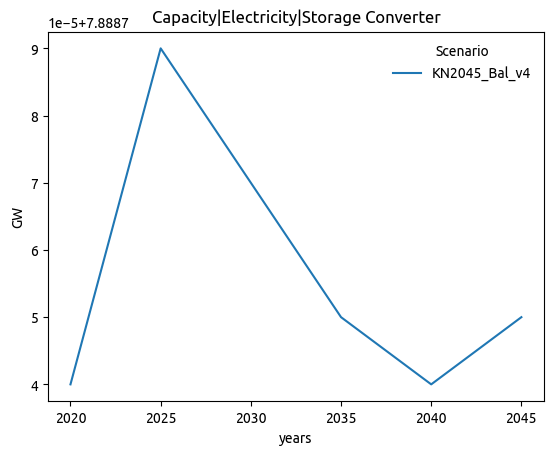
| Capacity|Electricity|Storage Converter | 0.455 | -0.130 |
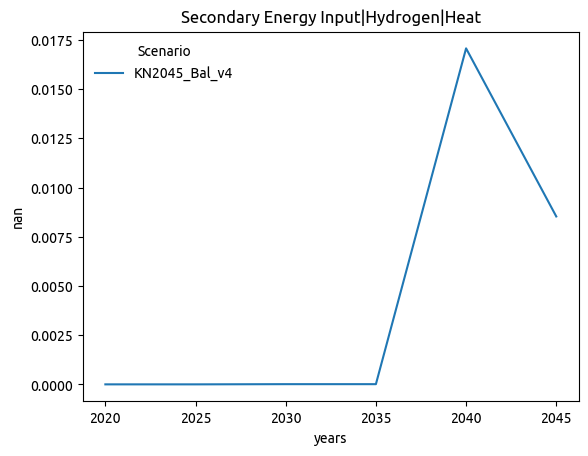
| Secondary Energy Input|Hydrogen|Heat | 0.453 | 0.869 |
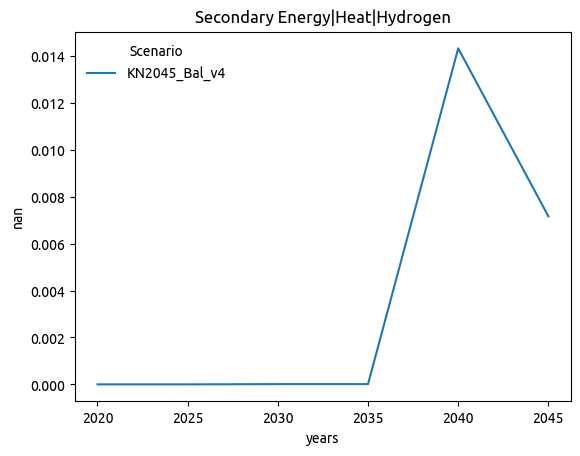
| Secondary Energy|Heat|Hydrogen | 0.453 | 0.867 |
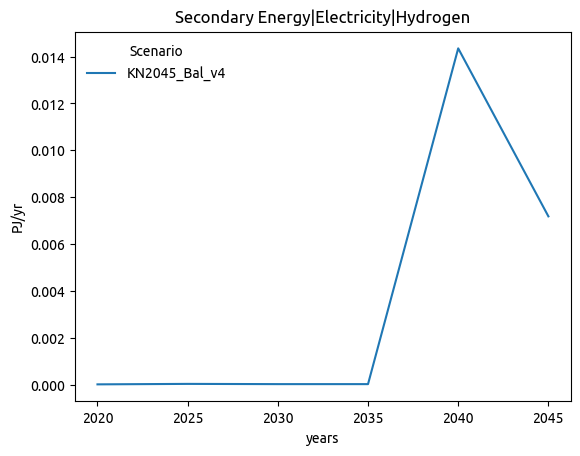
| Secondary Energy|Electricity|Hydrogen | 0.452 | 0.831 |
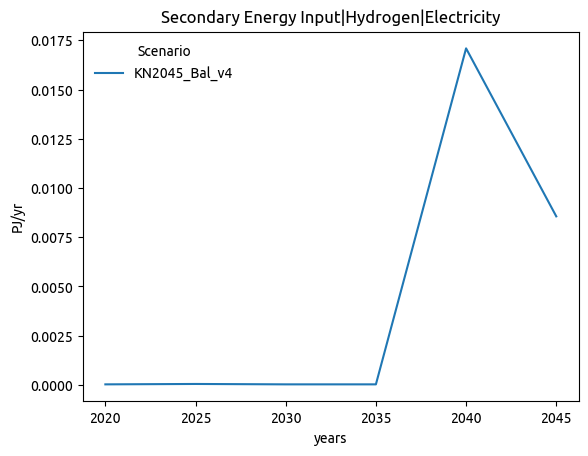
| Secondary Energy Input|Hydrogen|Electricity | 0.452 | 0.807 |
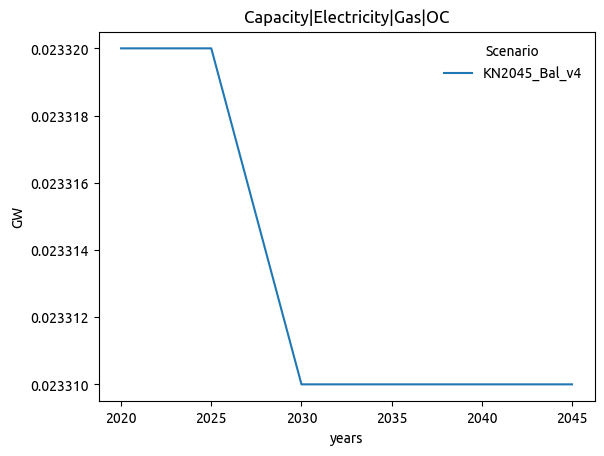
| Capacity|Electricity|Gas|OC | 0.408 | 0.632 |
| Capacity Additions|Heat|Hydrogen | 0.405 | 1.000 |
| Capacity Additions|Electricity|Hydrogen|FC | 0.404 | 0.986 |
| Capacity Additions|Electricity|Hydrogen | 0.404 | 0.986 |
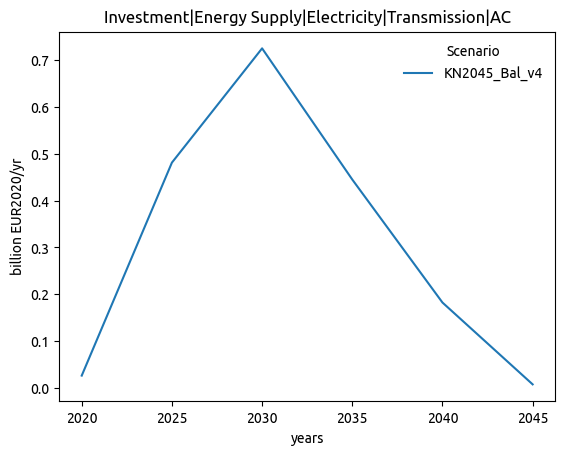
| Investment|Energy Supply|Electricity|Transmission|AC | 0.355 | 0.373 |
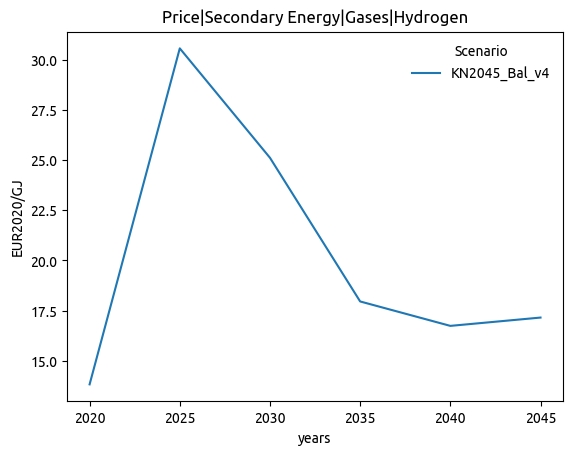
| Price|Secondary Energy|Gases|Hydrogen | 0.349 | 0.000 |
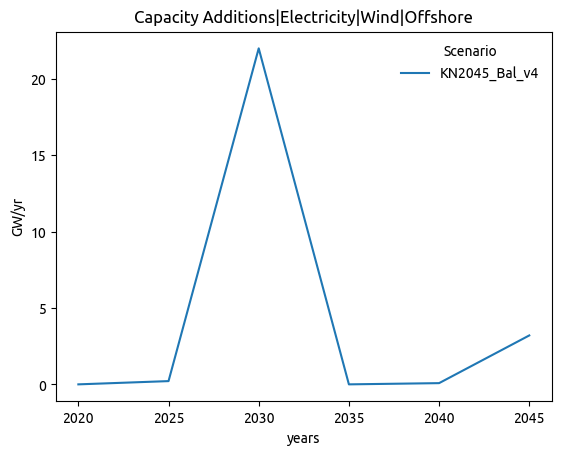
| Capacity Additions|Electricity|Wind|Offshore | 0.328 | 0.611 |
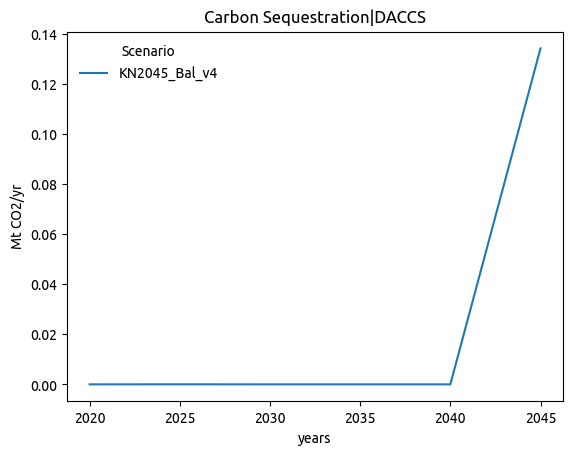
| Carbon Sequestration|DACCS | 0.317 | 1.000 |
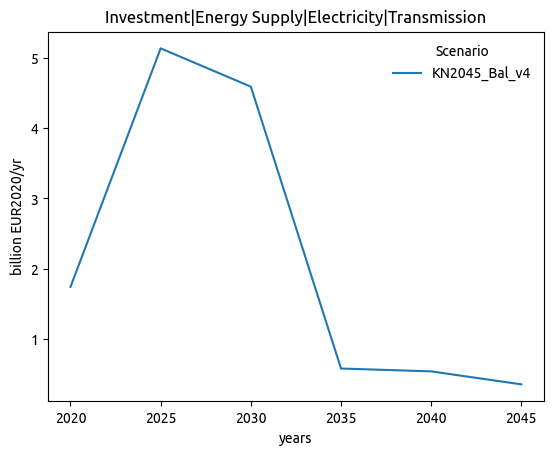
| Investment|Energy Supply|Electricity|Transmission | 0.306 | 0.828 |
| Investment|Energy Supply|Electricity|Transmission|DC | 0.295 | 0.856 |
| Secondary Energy|Electricity|Hydro | 0.253 | 0.915 |
| Secondary Energy|Electricity|Wind|Offshore | 0.238 | 0.821 |
| Capacity Additions|Electricity|Solar | 0.236 | 0.767 |
| Capacity Additions|Electricity|Solar|PV | 0.236 | 0.767 |
| Capacity Additions|Electricity|Solar|PV|Rooftop | 0.236 | 0.772 |
| Capacity|Electricity|Wind|Offshore | 0.228 | 0.839 |
| Trade|Secondary Energy|Electricity|Volume | 0.217 | 0.900 |
| Investment|Energy Supply|Electricity|Solar|PV|Rooftop | 0.211 | 0.887 |
| Investment|Energy Supply|Electricity|Solar|PV | 0.171 | 0.921 |
| Investment|Energy Supply|Electricity|Solar | 0.171 | 0.921 |
| Capacity|Electricity|Solar|PV|Rooftop | 0.155 | 0.953 |
| Capacity Additions|Electricity|Wind | 0.129 | 0.921 |
| Capacity|Electricity|Solar | 0.115 | 0.965 |
| Capacity|Electricity|Solar|PV | 0.115 | 0.965 |
| Investment|Energy Supply|Electricity|Wind | 0.112 | 0.959 |
| Capacity Additions|Electricity | 0.110 | 0.945 |
| Capacity Additions|Heat|Non-Renewable Waste | 0.106 | 0.993 |
| Capacity Additions|Electricity|Non-Renewable Waste | 0.106 | 0.993 |
| Primary Energy|Solar | 0.104 | 0.971 |
| Secondary Energy|Electricity|Solar | 0.104 | 0.971 |
| Capacity|Heat | 0.100 | 0.976 |
Plots
| Main branch | Feature branch |
|---|---|
 |
 |
 |
 |
 |
 |
 |
 |
 |
 |
 |
 |
 |
 |
 |
 |
 |
 |
 |
 |
 |
 |
 |
 |
 |
 |
 |
 |
 |
 |
 |
 |
 |
 |
 |
 |
 |
 |
 |
 |
General
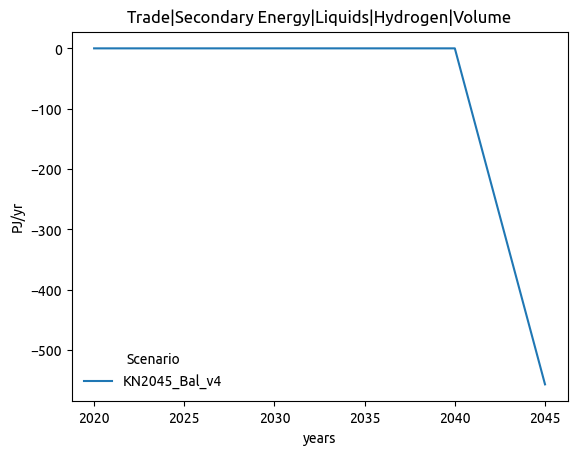
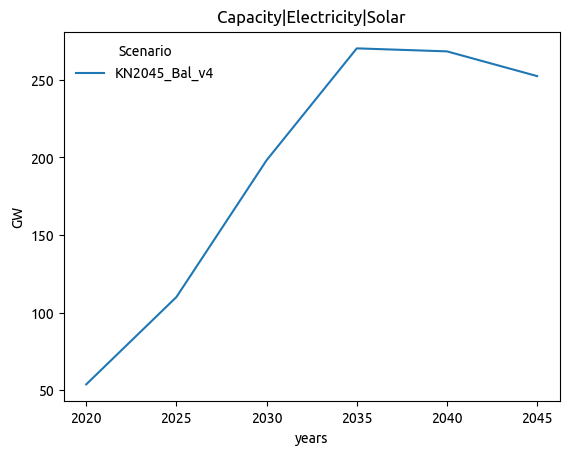
Plots comparison
| Main branch | Feature branch |
|---|---|
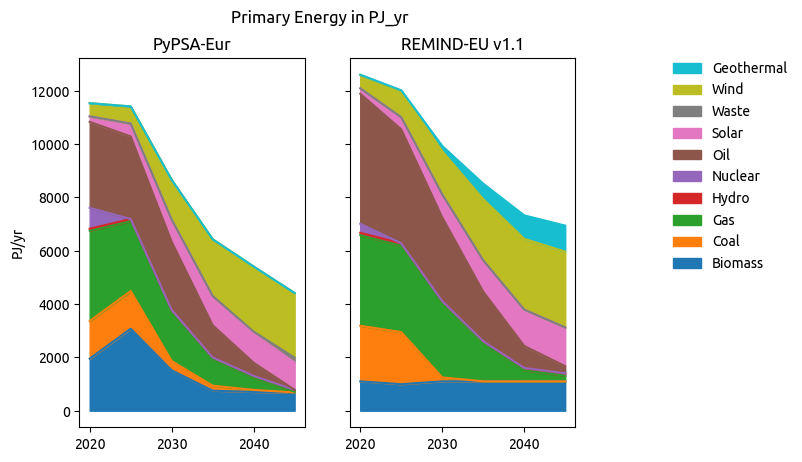 |
 |
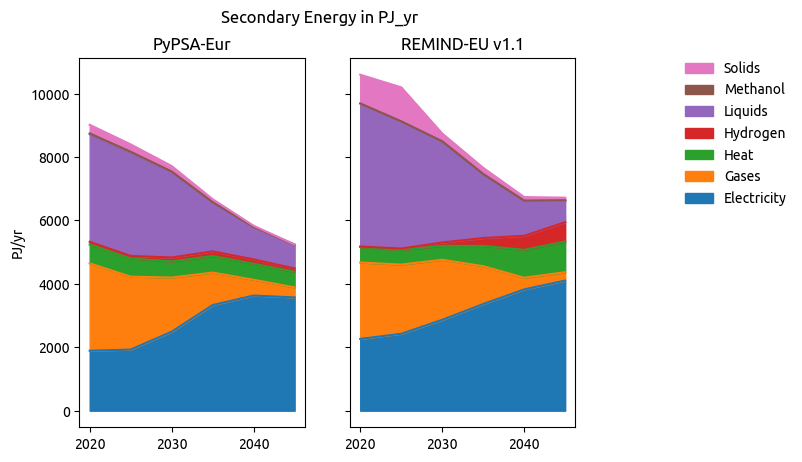 |
 |
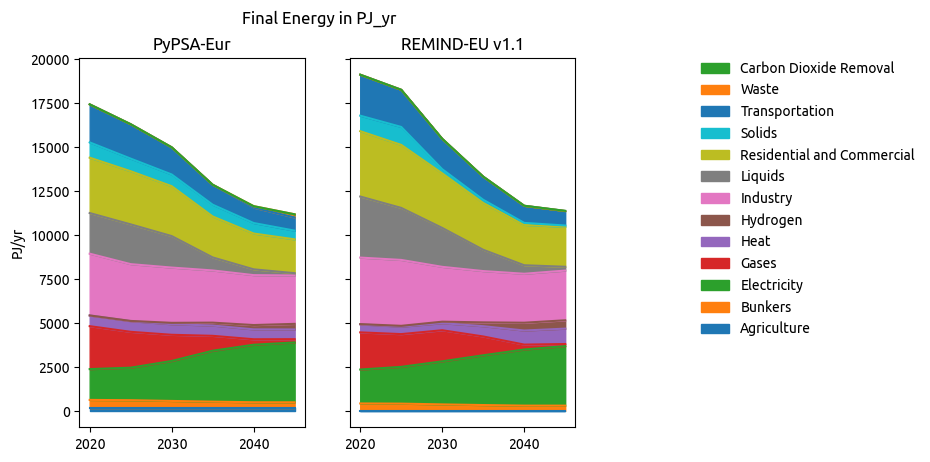 |
 |
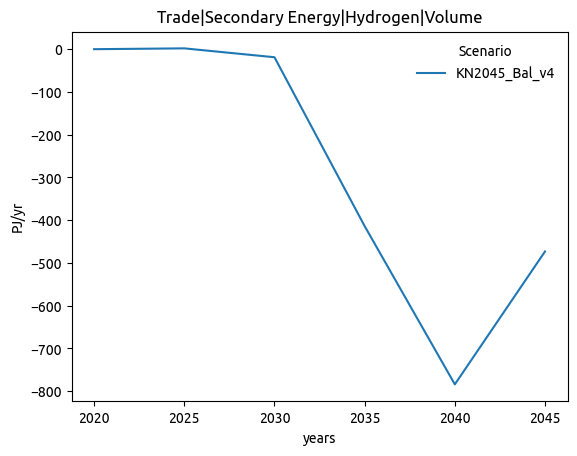 |
 |
 |
 |
 |
 |
Files comparison
| Status | NRMSE | MAE (norm) | |
|---|---|---|---|
| csvs/price_statistics.csv | :warning:Changed | 0.009 | 0.16 |
| csvs/cumulative_cost.csv | :warning:Changed | 0.000 | 0.11 |
| csvs/metrics.csv | :warning:Changed | 0.000 | 0.08 |
| csvs/curtailment.csv | :warning:Changed | 0.000 | 0.11 |
| csvs/nodal_cfs.csv | :warning: NaN mismatch | ||
| csvs/nodal_costs.csv | :warning: NaN mismatch | ||
| csvs/nodal_capacities.csv | :warning: NaN mismatch | ||
| csvs/nodal_supply_energy.csv | :warning: NaN mismatch | ||
| csvs/costs.csv | :white_check_mark: Almost equal | 0.001 | 0.00 |
| csvs/cfs.csv | :white_check_mark: Almost equal | 0.037 | 0.00 |
| csvs/supply.csv | :white_check_mark: Almost equal | 0.001 | 0.01 |
| csvs/capacities.csv | :white_check_mark: Almost equal | 0.000 | 0.00 |
| csvs/energy.csv | :white_check_mark: Almost equal | 0.001 | 0.01 |
| csvs/supply_energy.csv | :white_check_mark: Almost equal | 0.001 | 0.01 |
| csvs/prices.csv | :white_check_mark: Almost equal | 0.010 | 0.00 |
| csvs/market_values.csv | :white_check_mark: Almost equal | 0.045 | 0.02 |
| csvs/weighted_prices.csv | :white_check_mark: Equal |
Model Metrics
Benchmarks
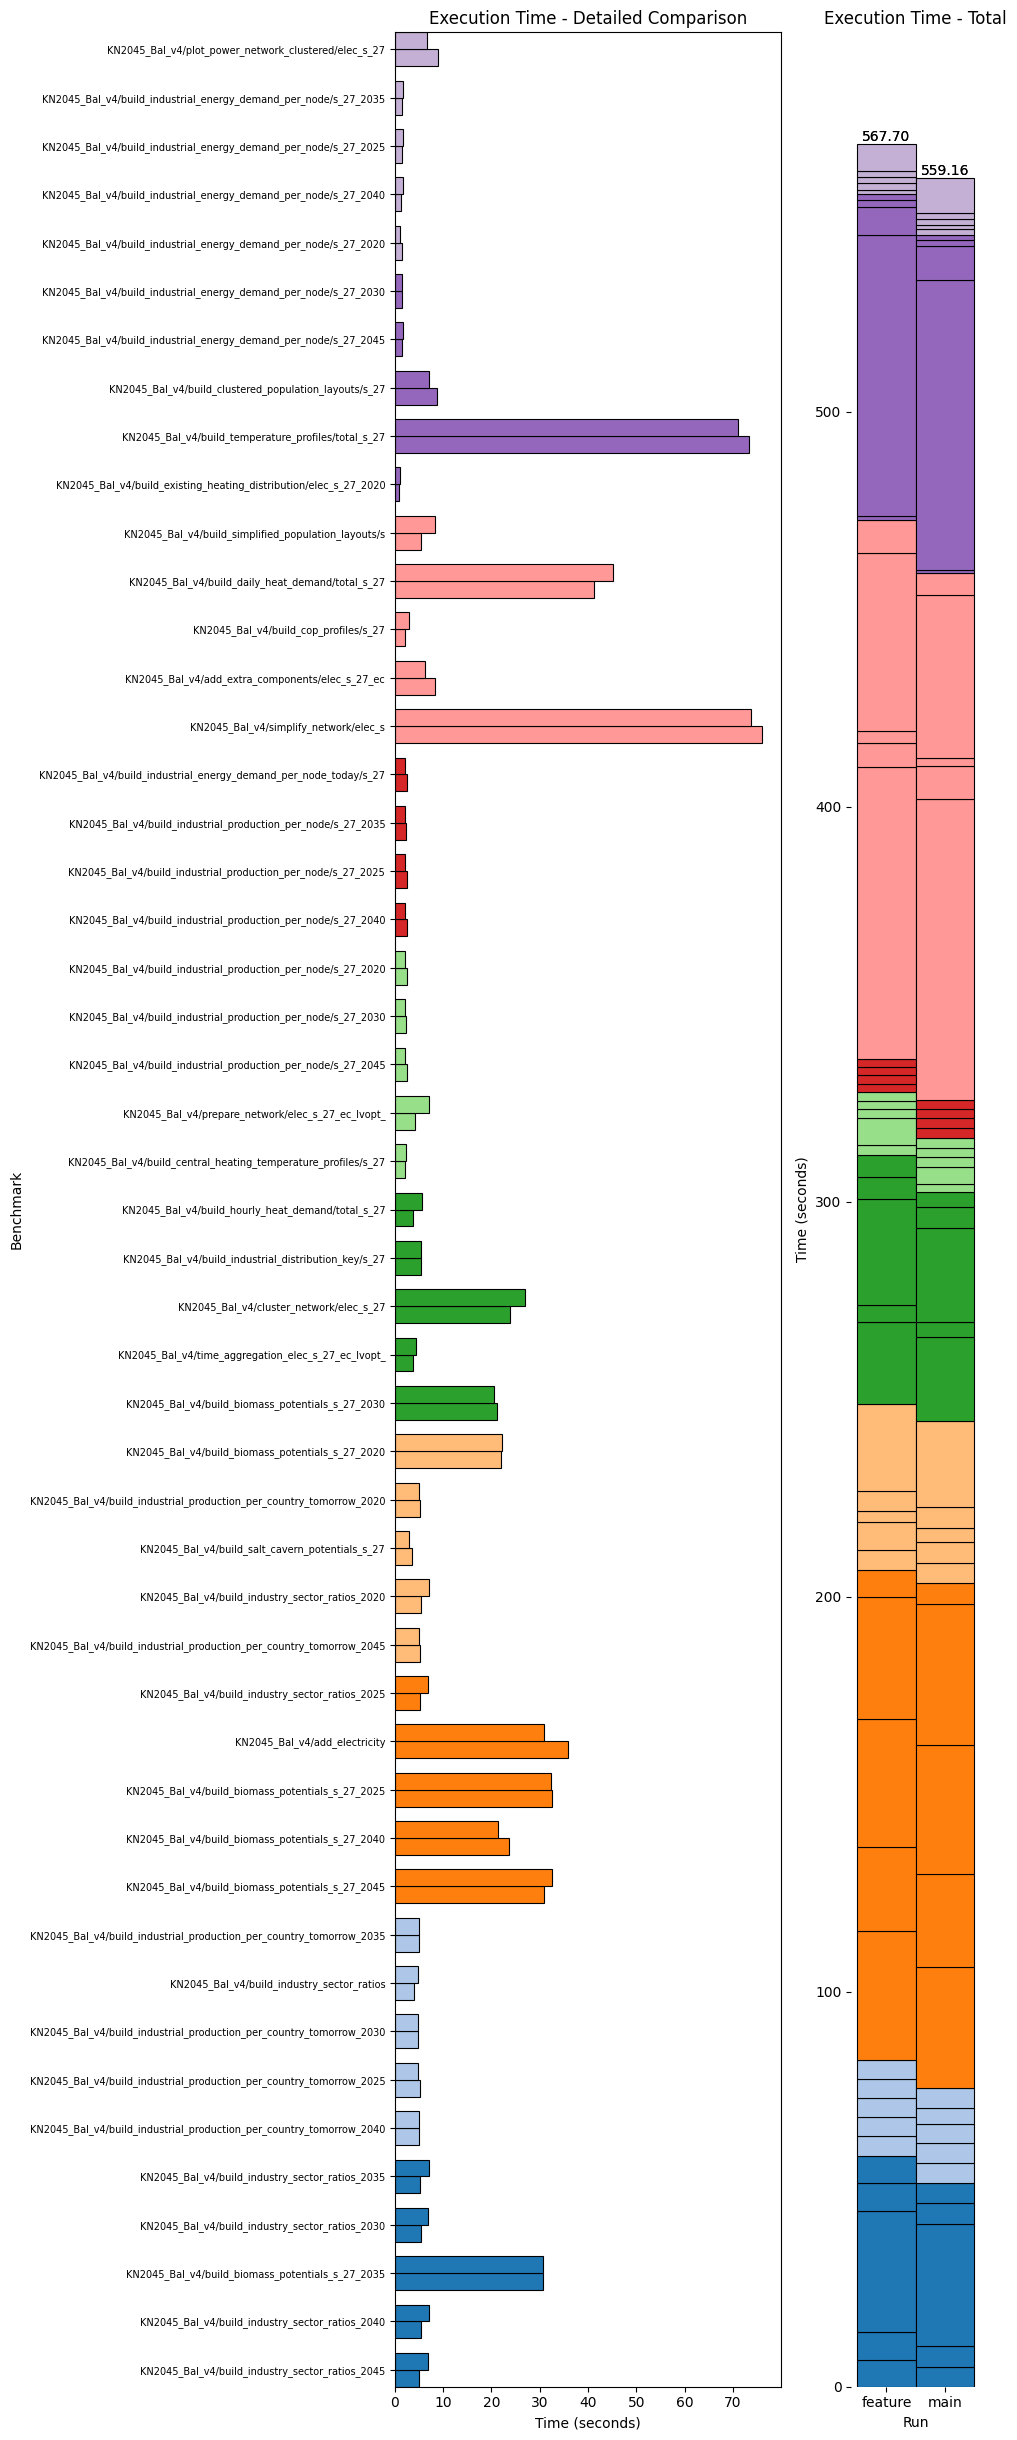

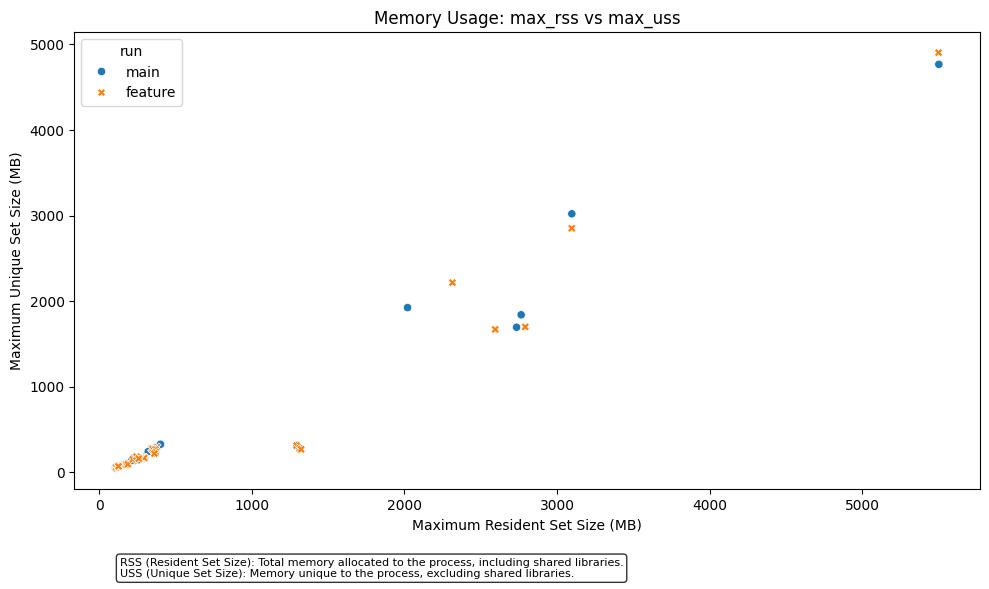
Comparing adjust-targets (38fd77c) with main (ed2abcf).
Branch is 3 commits ahead and 0 commits behind.
Last updated on 2024-09-27 17:35:59 CEST.
Before asking for a review for this PR make sure to complete the following checklist:
ariadne_allcompletes without errorsexport_ariadne_variableshas been adapted to the changesChangelog.mdmainhas been merged into the PRYYYYMMDDdescriptive_title