Validator Report
I am the Validator. Download all artifacts here. I'll be back and edit this comment for each new commit.
:warning: Config changes detected!
Results may differ due to these changes: ```diff diff --git a/config/config.yaml b/config/config.yaml index b0d4609..fb1a0a2 100644 --- a/config/config.yaml +++ b/config/config.yaml @@ -4,7 +4,7 @@ # docs in https://pypsa-eur.readthedocs.io/en/latest/configuration.html#run run: - prefix: 20241030_limit_FT + prefix: 20241030-PlotHeat name: # - CurrentPolicies @@ -238,11 +238,11 @@ clustering: # docs in https://pypsa-eur.readthedocs.io/en/latest/configuration.html#co2-budget co2_budget: - 2020: 0.720 # average emissions of 2019 to 2021 relative to 1990, excl LULUCF, EEA data, European Environment Agency. (2023a). Annual European Union greenhouse gas inventory 1990–2021 and inventory report 2023 - CRF Table. https://unfccc.int/documents/627830 - 2025: 0.648 # With additional measures (WAM) projection, CO2 excl LULUCF, European Environment Agency. (2023e). Member States’ greenhouse gas (GHG) emission projections 2023. https://www.eea.europa.eu/en/datahub/datahubitem-view/4b8d94a4-aed7-4e67-a54c-0623a50f48e8 + 2020: 0.800 # 20% reduction by 2020 + 2025: 0.620 2030: 0.450 # 55% reduction by 2030 (Ff55) 2035: 0.250 - 2040: 0.100 # 90% by 2040 + 2040: 0.100 # goal to be set next year 2045: 0.050 2050: 0.000 # climate-neutral by 2050 @@ -412,7 +412,7 @@ solving: line_unit_size: 1700 line_threshold: 0.3 link_unit_size: - DC: 1000 + DC: 2000 gas pipeline: 1500 gas pipeline new: 1500 H2 pipeline: 13000 @@ -551,12 +551,12 @@ solving: 2045: 325 FT_production: DE: - 2020: 15 - 2025: 15 - 2030: 15 - 2035: 15 - 2040: 15 - 2045: 15 + 2020: 200 + 2025: 200 + 2030: 200 + 2035: 200 + 2040: 200 + 2045: 200 limits_volume_min: electrolysis: DE: ```Ariadne Variables
Comparison
| NRMSE | Pearson | |
|---|---|---|
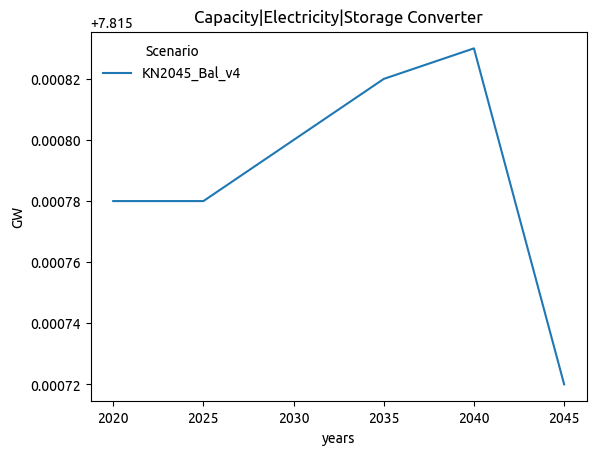
| Capacity|Electricity|Storage Converter | 0.487 | 0.365 |
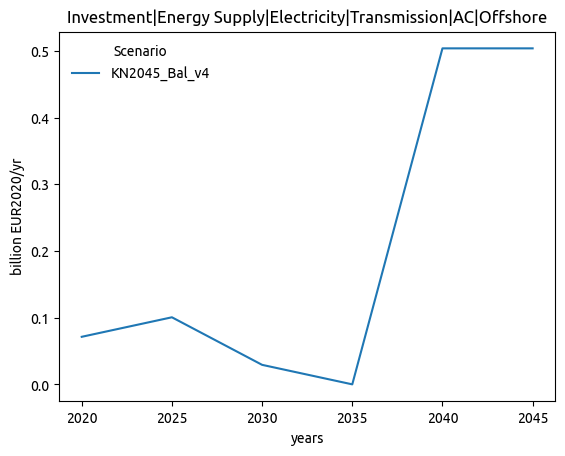
| Investment|Energy Supply|Electricity|Transmission|AC|Offshore | 0.480 | 0.584 |
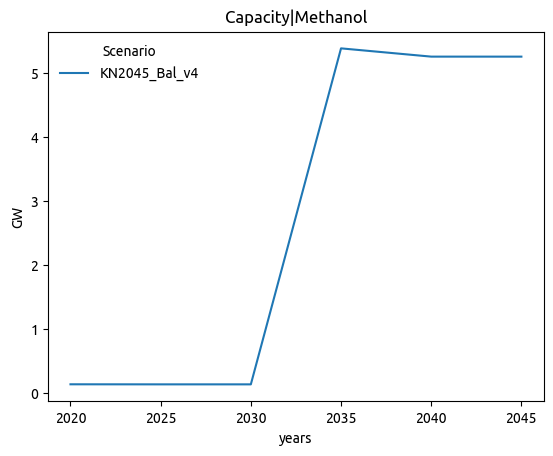
| Capacity|Methanol | 0.475 | 0.999 |
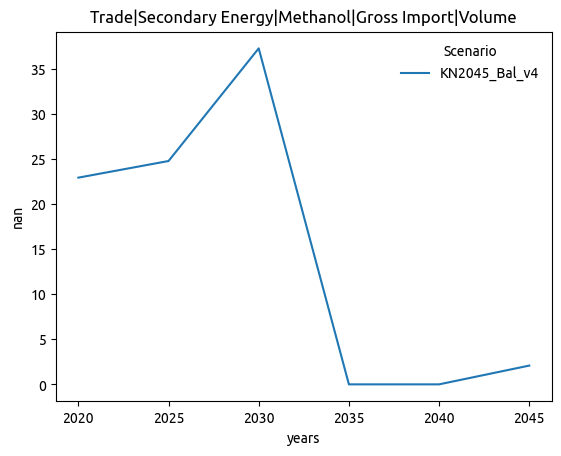
| Trade|Secondary Energy|Methanol|Gross Import|Volume | 0.463 | 0.288 |
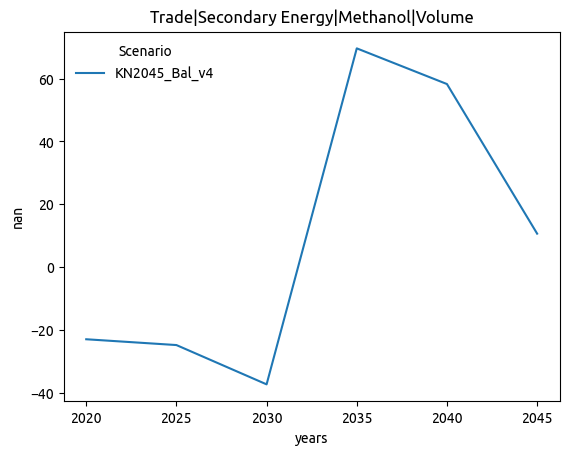
| Trade|Secondary Energy|Methanol|Volume | 0.462 | 0.530 |
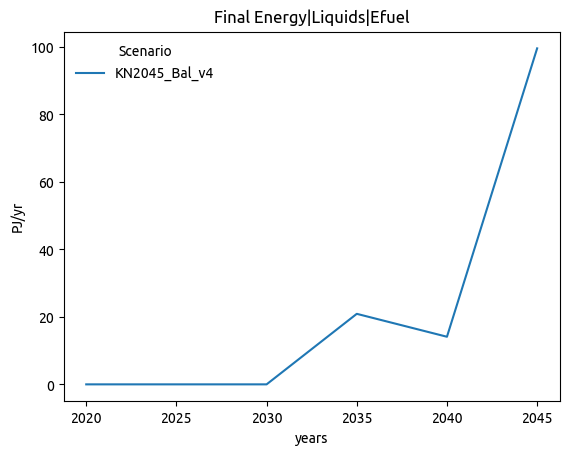
| Final Energy|Liquids|Efuel | 0.456 | 0.614 |
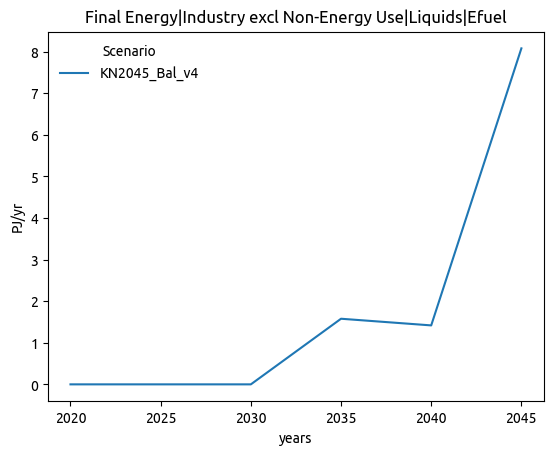
| Final Energy|Industry excl Non-Energy Use|Liquids|Efuel | 0.437 | 0.578 |
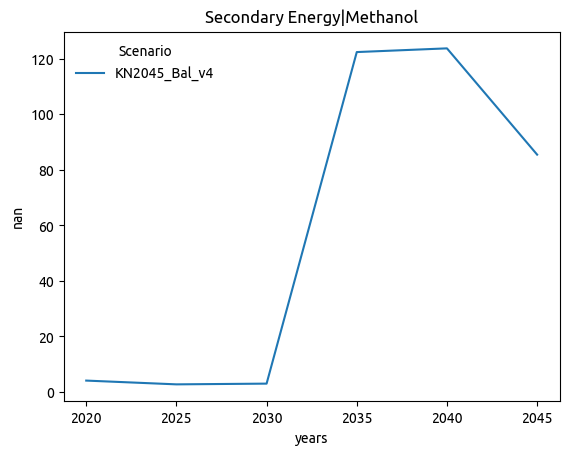
| Secondary Energy|Methanol | 0.428 | 0.998 |
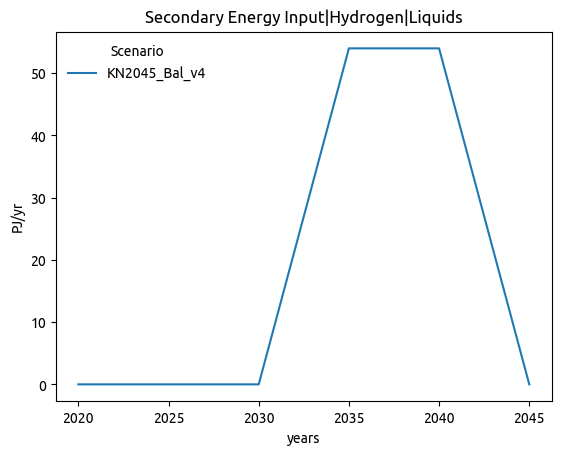
| Secondary Energy Input|Hydrogen|Liquids | 0.422 | 0.979 |
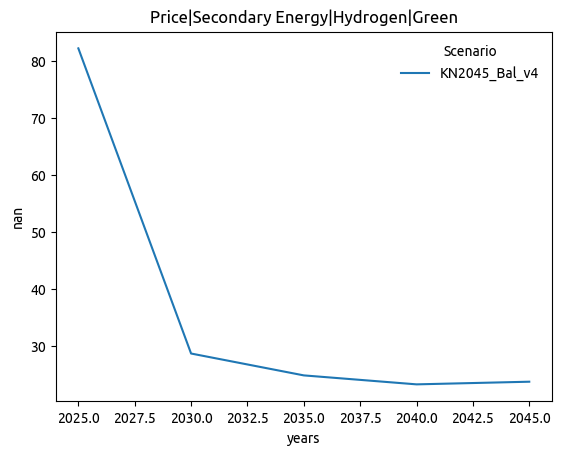
| Price|Secondary Energy|Hydrogen|Green | 0.408 | 0.000 |
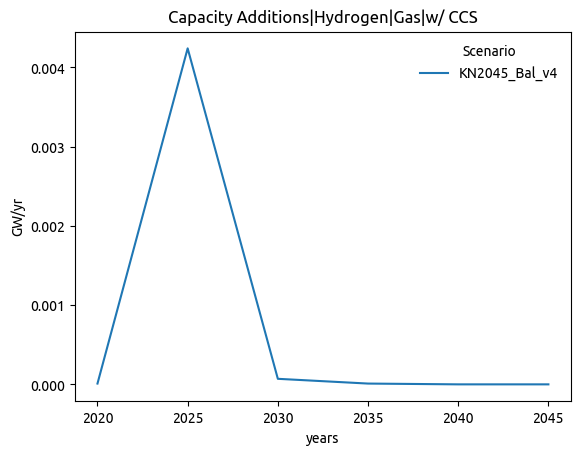
| Capacity Additions|Hydrogen|Gas|w/ CCS | 0.407 | 0.015 |
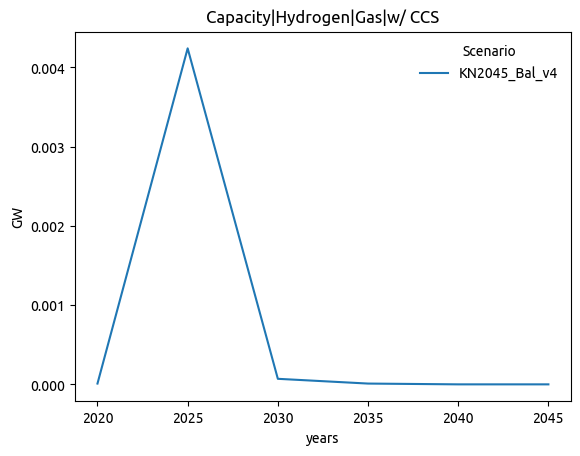
| Capacity|Hydrogen|Gas|w/ CCS | 0.407 | 0.015 |
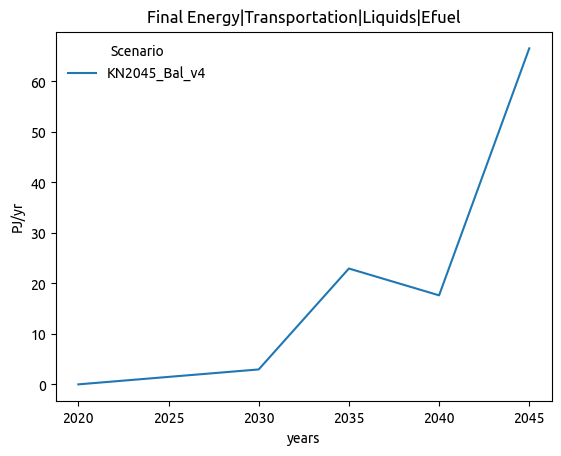
| Final Energy|Transportation|Liquids|Efuel | 0.407 | 0.605 |
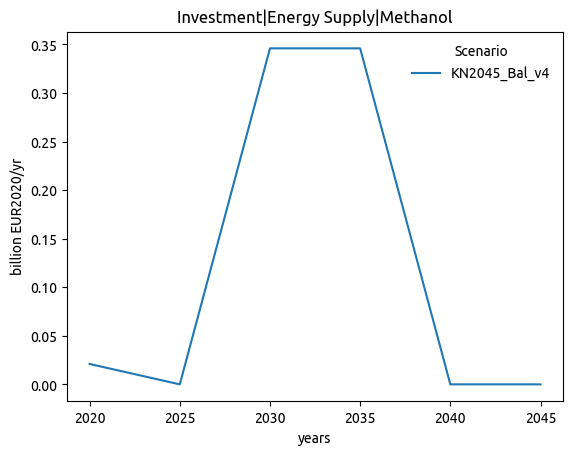
| Investment|Energy Supply|Methanol | 0.388 | 0.995 |
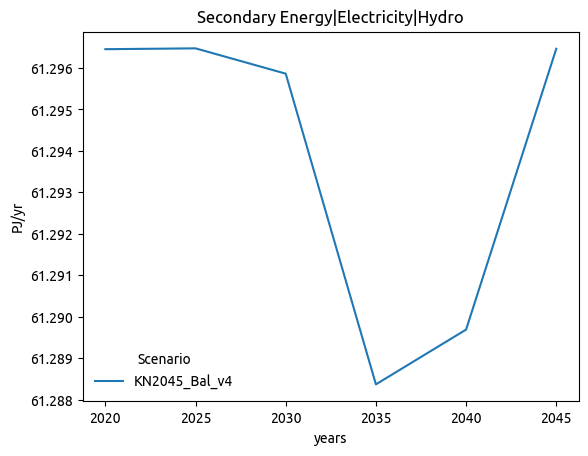
| Secondary Energy|Electricity|Hydro | 0.378 | 0.620 |
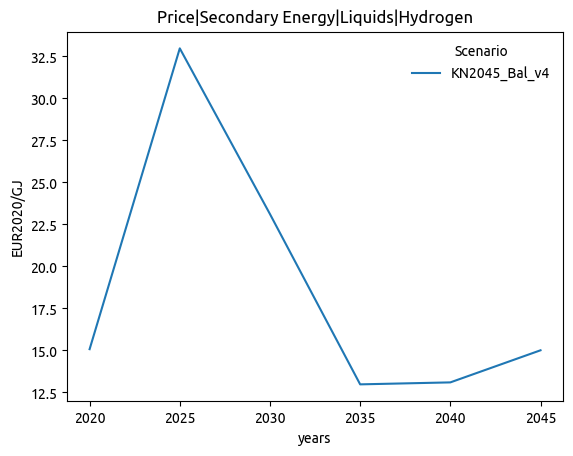
| Price|Secondary Energy|Liquids|Hydrogen | 0.340 | 0.686 |
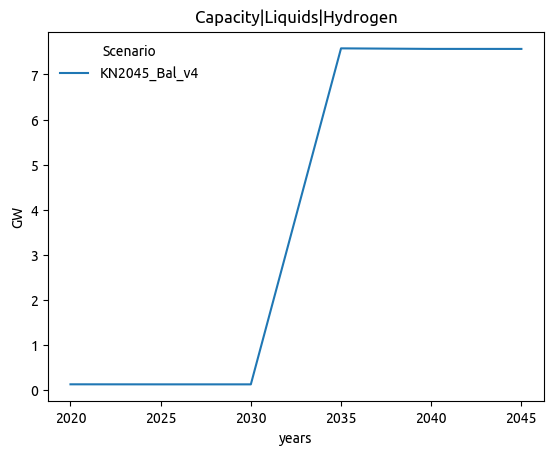
| Capacity|Liquids|Hydrogen | 0.332 | 0.988 |
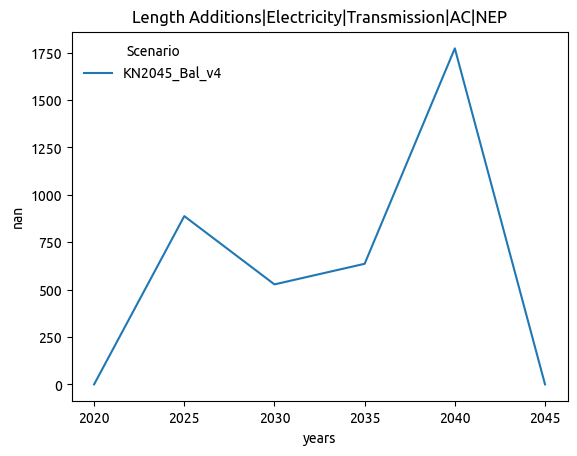
| Length Additions|Electricity|Transmission|AC|NEP | 0.326 | 0.987 |
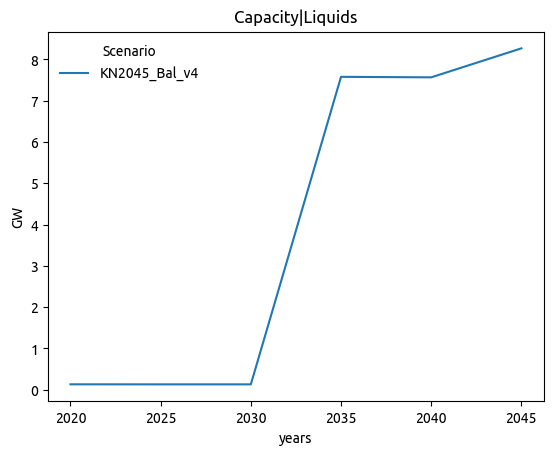
| Capacity|Liquids | 0.318 | 0.990 |
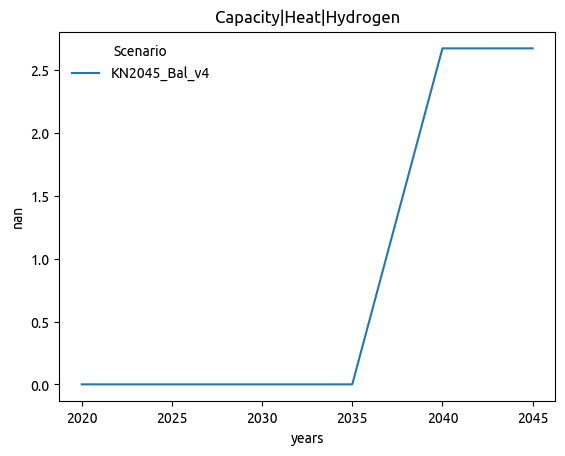
| Capacity|Heat|Hydrogen | 0.307 | 1.000 |
| Capacity|Electricity|Hydrogen|CC | 0.307 | 1.000 |
| Capacity|Electricity|Hydrogen | 0.307 | 1.000 |
| Investment|Energy Supply|Electricity|Hydrogen | 0.307 | 1.000 |
| Investment|Energy Supply|Heat|Hydrogen | 0.307 | 1.000 |
| Investment|Energy Supply|Electricity|Hydrogen|CC | 0.307 | 1.000 |
| Primary Energy|Oil|Electricity | 0.304 | 0.744 |
| Length Additions|Electricity|Transmission|AC | 0.292 | 0.757 |
| Capacity|Electricity|Gas|OC | 0.289 | 0.800 |
| Investment|Energy Supply|Heat|Gas | 0.279 | 0.698 |
| Capacity Additions|Heat|Gas | 0.278 | 0.687 |
| Capacity Additions|Methanol | 0.274 | 0.999 |
| Length Additions|Electricity|Transmission | 0.266 | 0.815 |
| Investment|Energy Supply|Electricity|Transmission|DC|Onshore|NEP | 0.263 | 1.000 |
| Investment|Energy Supply|Liquids|Hydrogen | 0.262 | 0.974 |
| Investment|Energy Supply|Heat|Biomass|w/o CCS | 0.261 | 1.000 |
| Investment|Energy Supply|Electricity|Biomass|Solids | 0.261 | 1.000 |
| Investment|Energy Supply|Heat|Biomass | 0.261 | 1.000 |
| Investment|Energy Supply|Electricity|Biomass | 0.261 | 1.000 |
| Investment|Energy Supply|Electricity|Biomass|w/o CCS | 0.261 | 1.000 |
| Price|Secondary Energy|Gases|Hydrogen | 0.260 | 0.000 |
| Investment|Energy Supply|Liquids | 0.260 | 0.962 |
| Emissions|CO2|Model|CCU | 0.252 | 0.961 |
| Investment|Energy Supply|Electricity|Transmission|Onshore|NEP | 0.242 | 0.996 |
| Capacity|Electricity|Transmission|AC | 0.240 | 0.989 |
| Secondary Energy Input|Hydrogen|Heat | 0.237 | 0.999 |
| Secondary Energy|Heat|Hydrogen | 0.237 | 0.999 |
| Secondary Energy|Electricity|Hydrogen | 0.237 | 0.999 |
| Secondary Energy Input|Hydrogen|Electricity | 0.237 | 0.999 |
| Secondary Energy|Liquids|Hydrogen | 0.232 | 0.954 |
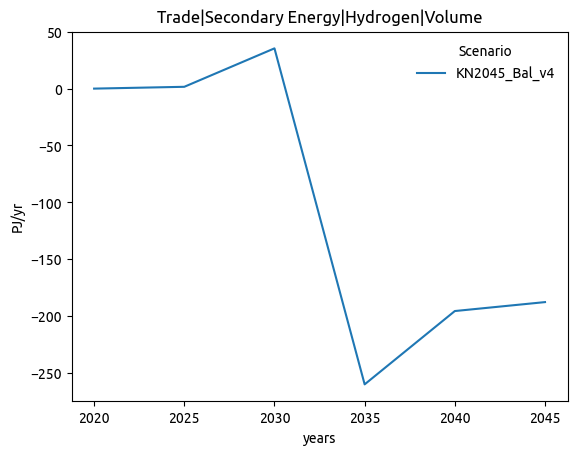
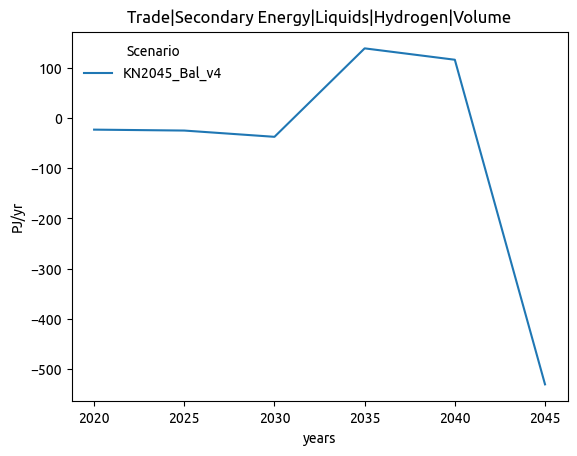
| Trade|Secondary Energy|Hydrogen|Volume | 0.226 | 0.912 |
| Capacity Additions|Heat|Processes | 0.220 | 0.853 |
| Capacity Additions|Electricity|Hydrogen|CC | 0.217 | 1.000 |
| Capacity Additions|Heat|Hydrogen | 0.217 | 1.000 |
| Capacity Additions|Electricity|Hydrogen | 0.217 | 1.000 |
| Capacity Additions|Hydrogen | 0.214 | 0.790 |
| Capacity Additions|Hydrogen|Electricity | 0.214 | 0.808 |
| Capacity Additions|Electricity|Transmission|AC | 0.211 | 0.867 |
| Investment|Energy Supply|Electricity|Transmission|DC|Onshore | 0.206 | 0.999 |
| Emissions|CO2|Efuels|Liquids | 0.204 | 0.876 |
| Capacity Additions|Electricity|Transmission | 0.203 | 0.867 |
| Investment|Energy Supply|Electricity|Transmission|Onshore | 0.200 | 0.978 |
| Capacity Additions|Liquids | 0.199 | 0.957 |
| Capacity Additions|Liquids|Hydrogen | 0.199 | 0.962 |
| Capacity|Heat|Processes | 0.195 | 0.991 |
| Secondary Energy|Electricity|Oil | 0.193 | 0.901 |
| Final Energy|Industry|Liquids|Efuel | 0.192 | 0.891 |
| Capacity Additions|Heat|Biomass|w/o CCS | 0.184 | 1.000 |
| Capacity Additions|Electricity|Biomass|w/o CCS | 0.184 | 1.000 |
| Capacity Additions|Electricity|Biomass|Solids | 0.184 | 1.000 |
| Capacity Additions|Electricity|Biomass | 0.184 | 1.000 |
| Capacity Additions|Heat|Biomass | 0.184 | 1.000 |
| Final Energy|Non-Energy Use|Liquids|Efuel | 0.182 | 0.902 |
| Trade|Secondary Energy|Electricity|Volume | 0.181 | 0.894 |
| Price|Secondary Energy|Liquids | 0.177 | 0.910 |
| Capacity|Electricity|Transmission | 0.169 | 0.995 |
| Capacity|Heat|Gas | 0.167 | 0.990 |
| Capacity|Electricity|Transmission|AC|NEP | 0.164 | 0.963 |
| Length Additions|Electricity|Transmission|NEP | 0.163 | 0.942 |
| Investment|Energy Supply|Hydrogen|Electrolysis | 0.162 | 0.909 |
| Investment|Energy Supply|Hydrogen|Electricity | 0.162 | 0.909 |
| Price|Final Energy|Residential and Commercial|Gases | 0.161 | 0.954 |
| Capacity|Electricity|Gas | 0.159 | 0.985 |
| Capacity|Electricity|Gas|w/o CCS | 0.159 | 0.985 |
| Secondary Energy|Heat|Oil | 0.157 | 0.994 |
| Final Energy|Bunkers|Aviation|Liquids|Efuel | 0.155 | 0.929 |
| Primary Energy|Oil|Heat | 0.152 | 0.995 |
| Secondary Energy|Heat|Other | 0.145 | 0.951 |
| Investment|Energy Supply|Heat|Processes | 0.142 | 0.962 |
| Trade|Secondary Energy|Liquids|Hydrogen|Volume | 0.134 | 0.946 |
| Investment|Energy Supply|Electricity|Transmission|DC | 0.128 | 0.994 |
| Secondary Energy|Hydrogen | 0.125 | 0.959 |
| Capacity|Heat | 0.121 | 0.992 |
| Capacity Additions|Heat | 0.115 | 0.931 |
| Emissions|CO2|Efuels|Gases | 0.115 | 0.971 |
| Investment|Energy Supply|Electricity|Transmission | 0.114 | 0.980 |
| Investment|Energy Supply|Electricity|Transmission|DC|NEP | 0.112 | 1.000 |
| Emissions|CO2|Energy|Demand|Other Sector | 0.110 | 0.965 |
| Investment|Energy Supply|Electricity|Solar|PV|Open Field | 0.108 | 0.980 |
| Secondary Energy|Hydrogen|Electricity | 0.104 | 0.973 |
| Secondary Energy Input|Electricity|Hydrogen | 0.102 | 0.973 |
Plots
| Main branch | Feature branch |
|---|---|
 |
 |
 |
 |
 |
 |
 |
 |
 |
 |
 |
 |
 |
 |
 |
 |
 |
 |
 |
 |
 |
 |
 |
 |
 |
 |
 |
 |
 |
 |
 |
 |
 |
 |
 |
 |
 |
 |
 |
 |
General
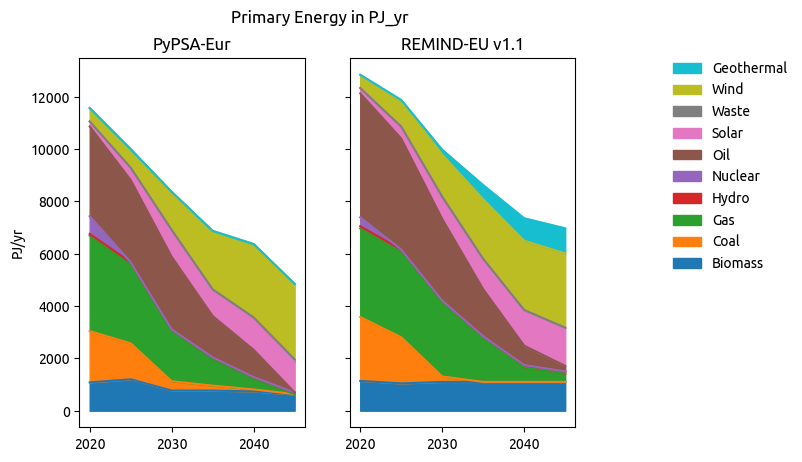
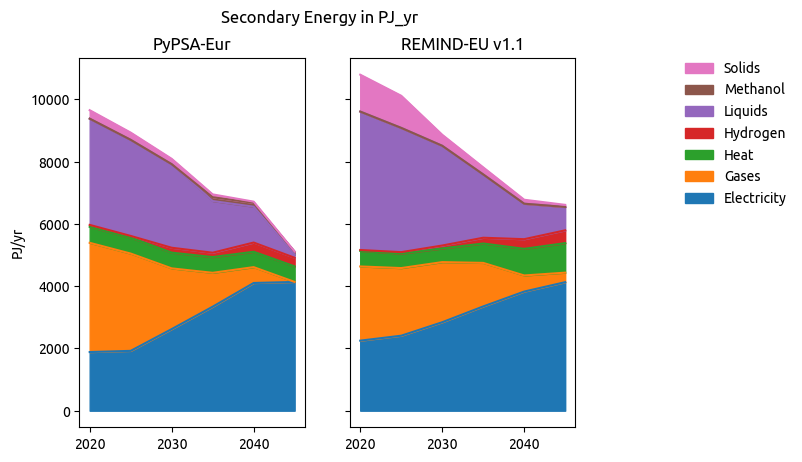
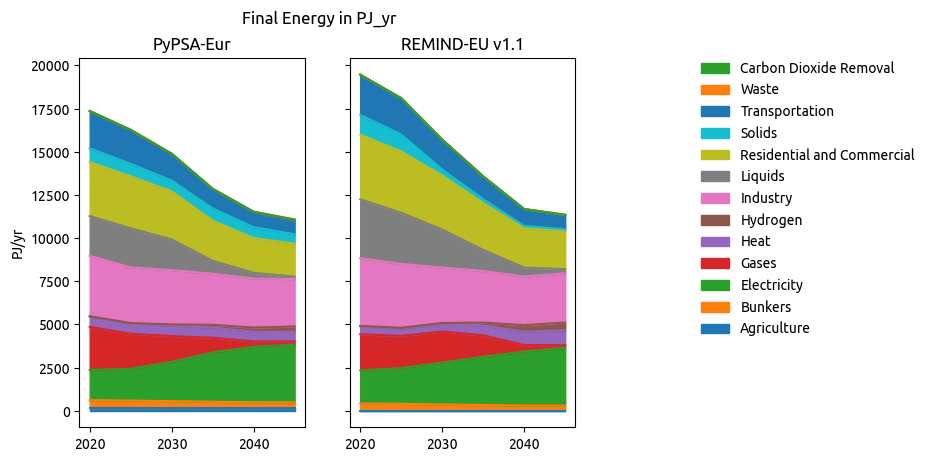
Plots comparison
| Main branch | Feature branch |
|---|---|
 |
 |
 |
 |
 |
 |
 |
 |
 |
 |
 |
 |
Files comparison
| Status | NRMSE | MAE (norm) | |
|---|---|---|---|
| csvs/metrics.csv | :warning:Changed | 0.002 | 0.15 |
| csvs/curtailment.csv | :warning:Changed | 0.000 | 0.13 |
| csvs/price_statistics.csv | :warning:Changed | 0.017 | 0.16 |
| csvs/cumulative_cost.csv | :warning:Changed | 0.002 | 0.11 |
| csvs/nodal_cfs.csv | :warning: NaN mismatch | ||
| csvs/nodal_supply_energy.csv | :warning: NaN mismatch | ||
| csvs/nodal_costs.csv | :warning: NaN mismatch | ||
| csvs/nodal_capacities.csv | :warning: NaN mismatch | ||
| csvs/capacities.csv | :white_check_mark: Almost equal | 0.000 | 0.00 |
| csvs/market_values.csv | :white_check_mark: Almost equal | 0.049 | 0.02 |
| csvs/supply.csv | :white_check_mark: Almost equal | 0.002 | 0.01 |
| csvs/prices.csv | :white_check_mark: Almost equal | 0.004 | 0.04 |
| csvs/cfs.csv | :white_check_mark: Almost equal | 0.055 | 0.01 |
| csvs/costs.csv | :white_check_mark: Almost equal | 0.001 | 0.01 |
| csvs/supply_energy.csv | :white_check_mark: Almost equal | 0.001 | 0.02 |
| csvs/energy.csv | :white_check_mark: Almost equal | 0.001 | 0.01 |
| csvs/weighted_prices.csv | :white_check_mark: Equal |
Model Metrics
Benchmarks


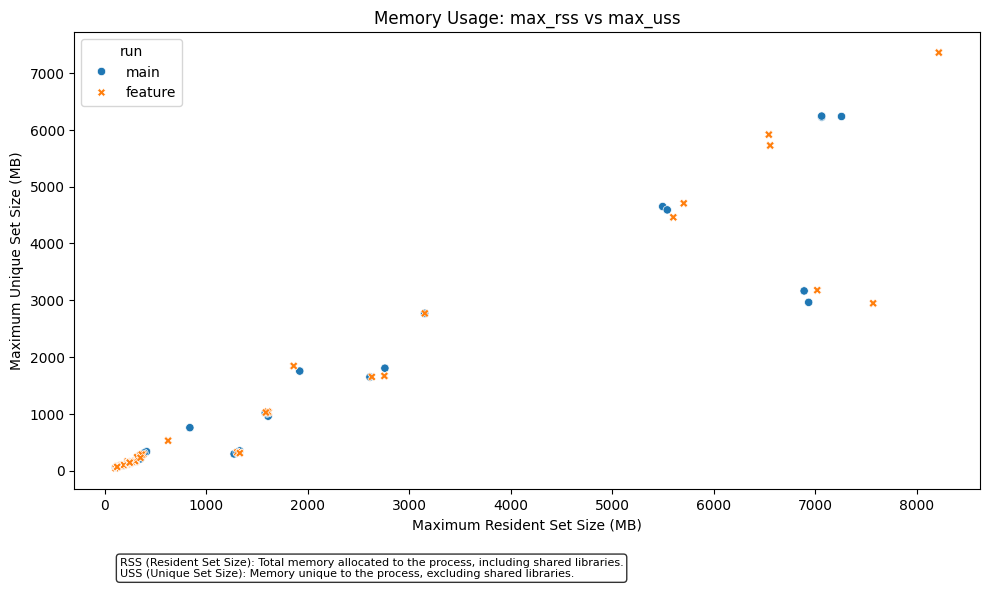
Comparing refactor-post-discretization (0d79195) with main (06b56b4).
Branch is 4 commits ahead and 5 commits behind.
Last updated on 2024-11-01 13:22:25 CET.
Before asking for a review for this PR make sure to complete the following checklist:
ariadne_allcompletes without errorsexport_ariadne_variableshas been adapted to the changesChangelog.mdmainhas been merged into the PRYYYYMMDDdescriptive_title