Validator Report
I am the Validator. Download all artifacts here. I'll be back and edit this comment for each new commit.
Ariadne Variables
Comparison
| NRMSE | Pearson | |
|---|---|---|
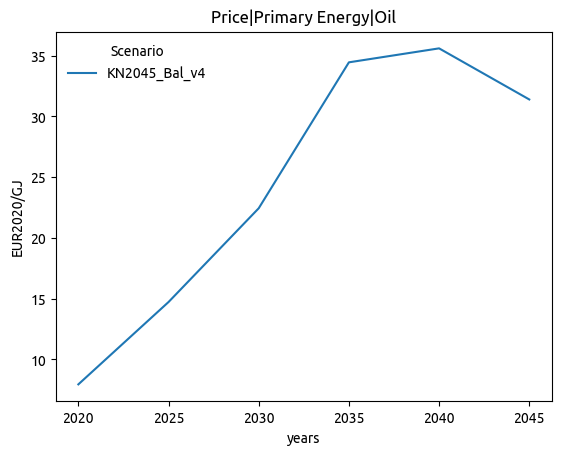
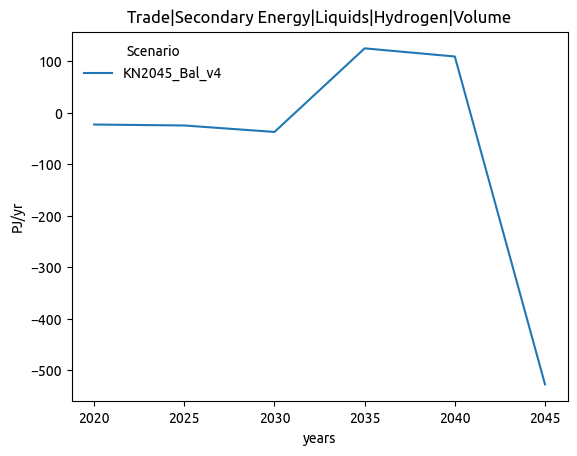
| Price|Primary Energy|Oil | 0.360 | 0.000 |
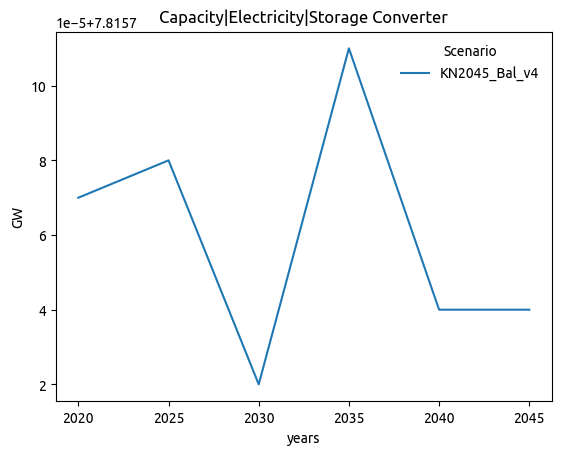
| Capacity|Electricity|Storage Converter | 0.333 | 0.636 |
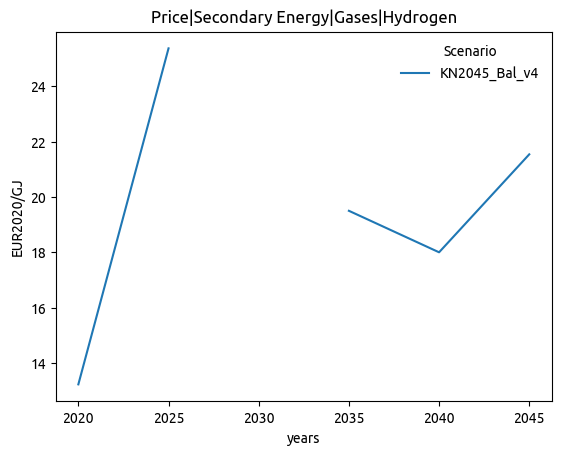
| Price|Secondary Energy|Gases|Hydrogen | 0.325 | 0.000 |
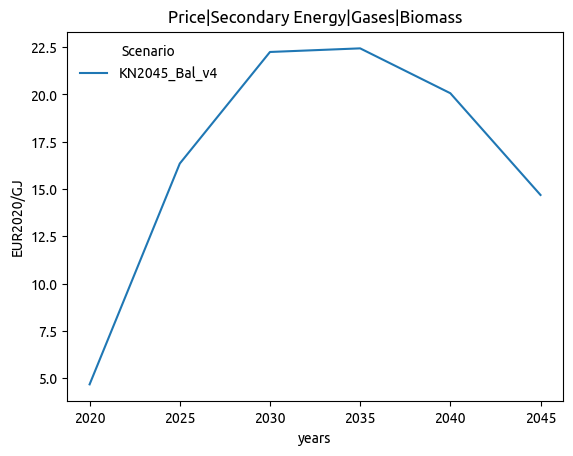
| Price|Secondary Energy|Gases|Biomass | 0.267 | 0.000 |
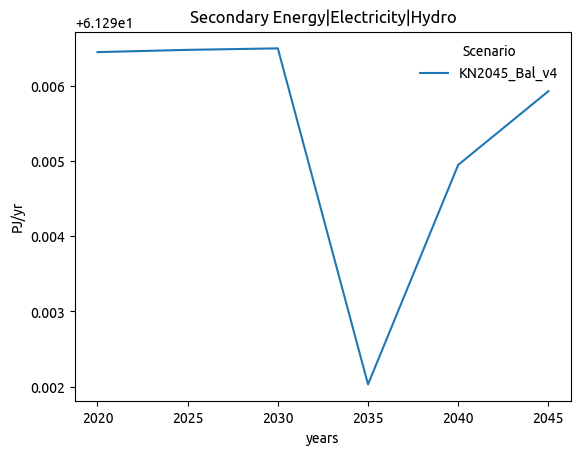
| Secondary Energy|Electricity|Hydro | 0.225 | 0.992 |
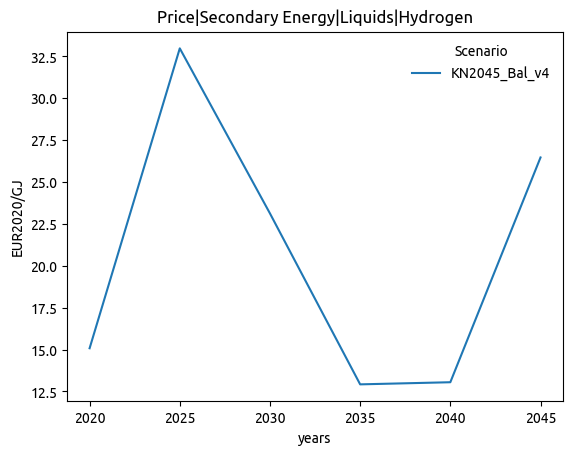
| Price|Secondary Energy|Liquids|Hydrogen | 0.221 | 0.848 |
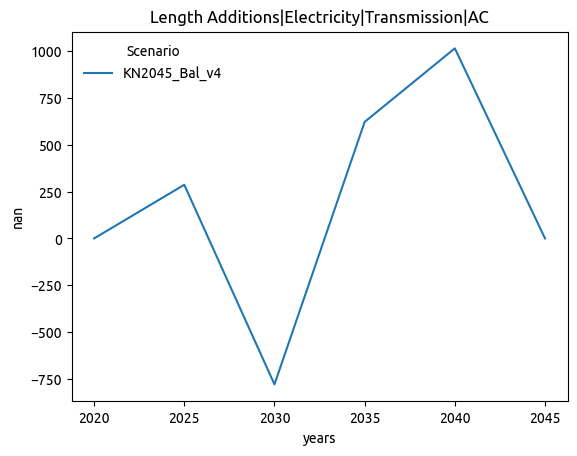
| Length Additions|Electricity|Transmission|AC | 0.205 | 0.788 |
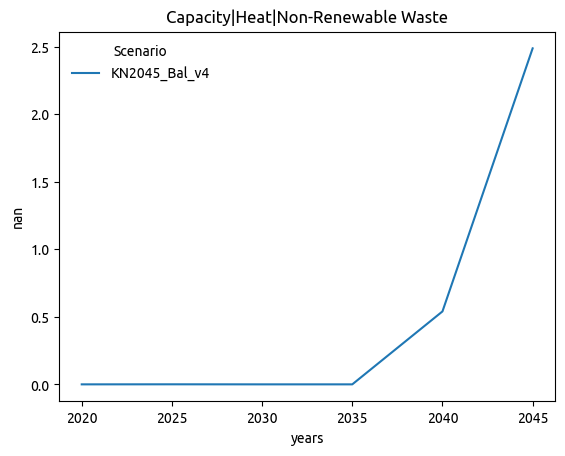
| Capacity|Heat|Non-Renewable Waste | 0.167 | 0.980 |
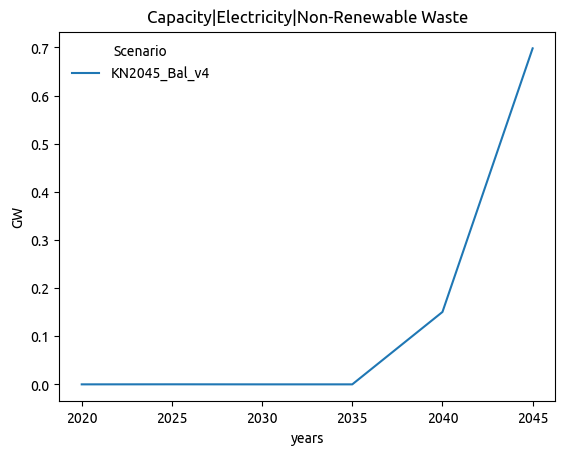
| Capacity|Electricity|Non-Renewable Waste | 0.162 | 0.982 |
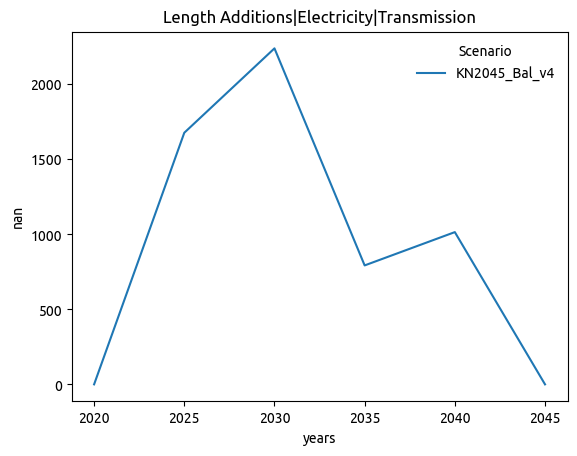
| Length Additions|Electricity|Transmission | 0.145 | 0.964 |
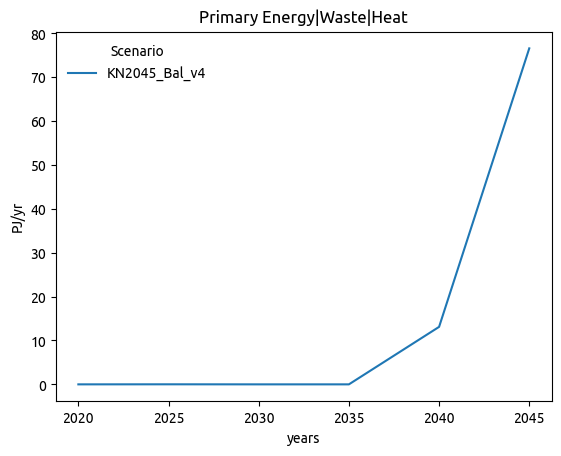
| Primary Energy|Waste|Heat | 0.120 | 0.981 |
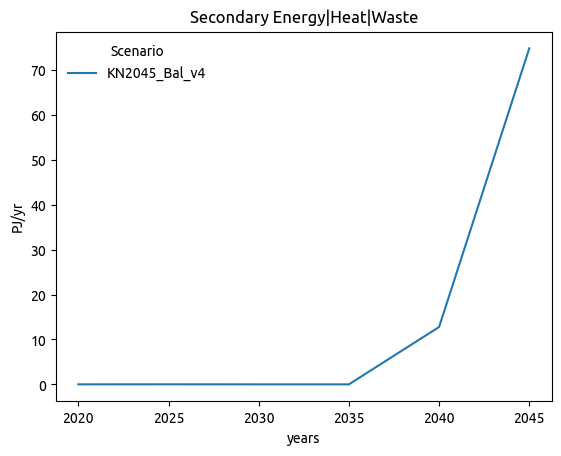
| Secondary Energy|Heat|Waste | 0.119 | 0.982 |
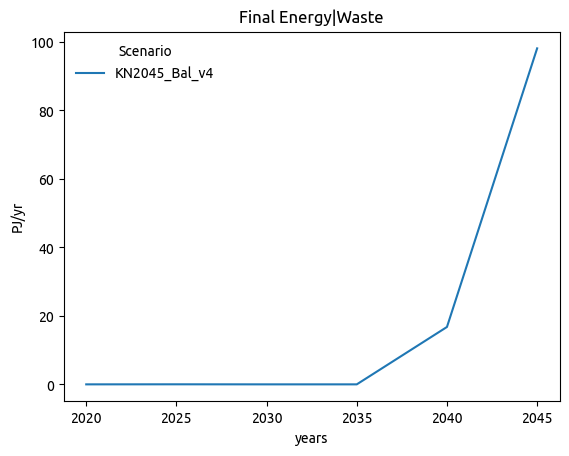
| Final Energy|Waste | 0.119 | 0.982 |
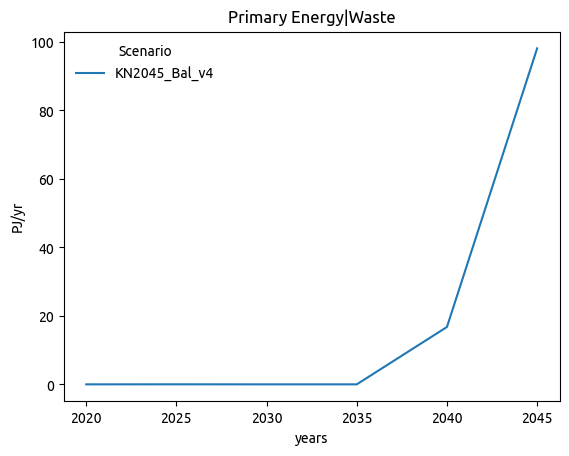
| Primary Energy|Waste | 0.119 | 0.982 |
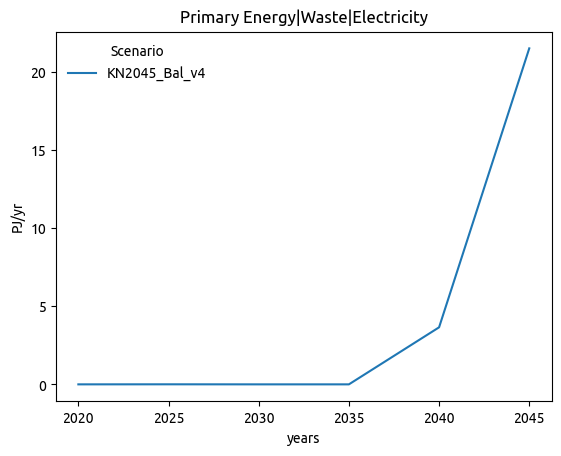
| Primary Energy|Waste|Electricity | 0.116 | 0.983 |
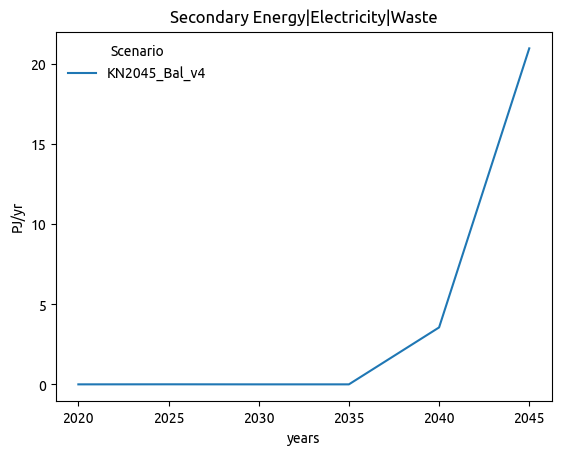
| Secondary Energy|Electricity|Waste | 0.115 | 0.983 |
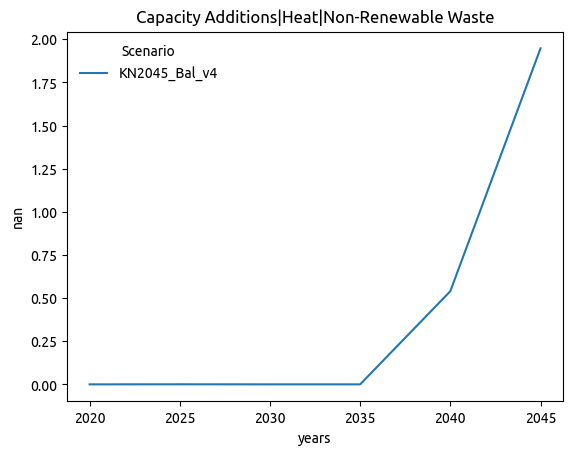
| Capacity Additions|Heat|Non-Renewable Waste | 0.113 | 0.960 |
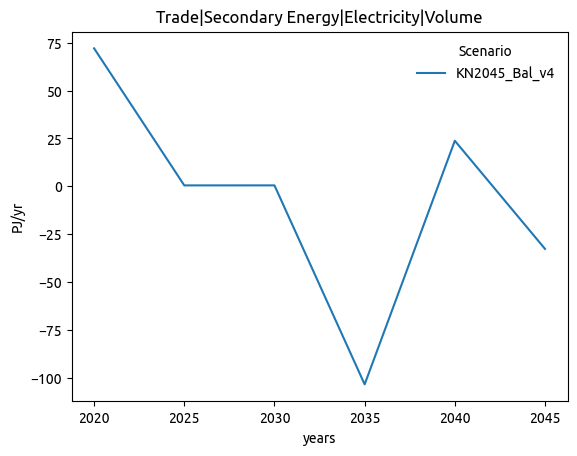
| Trade|Secondary Energy|Electricity|Volume | 0.112 | 0.956 |
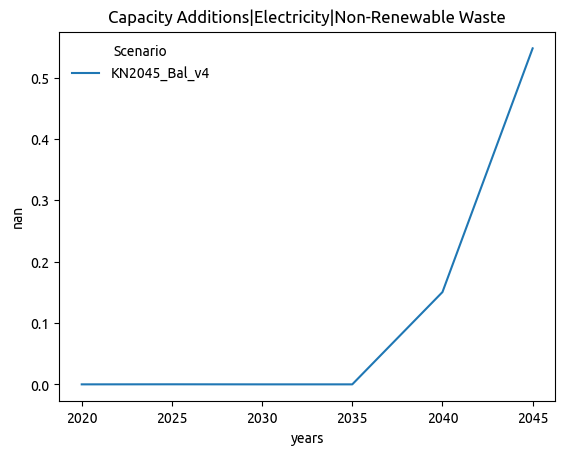
| Capacity Additions|Electricity|Non-Renewable Waste | 0.108 | 0.963 |
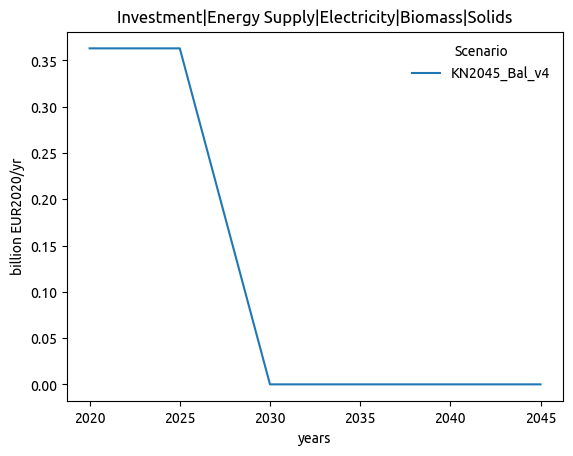
| Investment|Energy Supply|Electricity|Biomass|Solids | 0.105 | 1.000 |
| Investment|Energy Supply|Electricity|Biomass|w/o CCS | 0.105 | 1.000 |
| Investment|Energy Supply|Heat|Biomass|w/o CCS | 0.105 | 1.000 |
| Investment|Energy Supply|Heat|Biomass | 0.105 | 1.000 |
| Investment|Energy Supply|Electricity|Biomass | 0.105 | 1.000 |
| Investment|Energy Supply|Electricity|Non-Renewable Waste | 0.102 | 0.982 |
| Investment|Energy Supply|Heat|Non-Renewable Waste | 0.102 | 0.982 |
Plots
| Main branch | Feature branch |
|---|---|
 |
 |
 |
 |
 |
 |
 |
 |
 |
 |
 |
 |
 |
 |
 |
 |
 |
 |
 |
 |
 |
 |
 |
 |
 |
 |
 |
 |
 |
 |
 |
 |
 |
 |
 |
 |
 |
 |
 |
 |
General
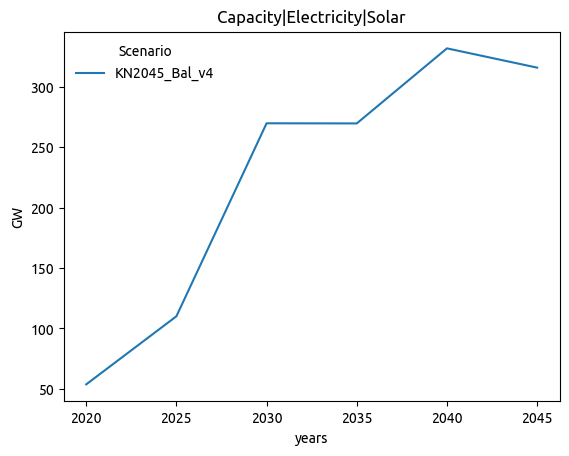
Plots comparison
| Main branch | Feature branch |
|---|---|
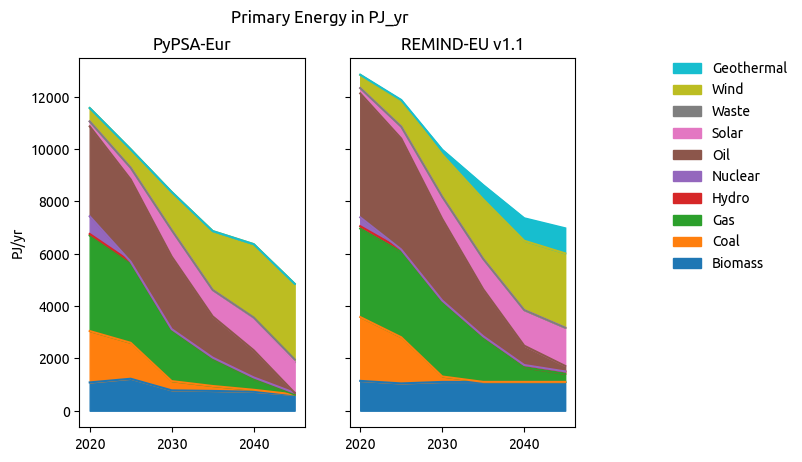 |
 |
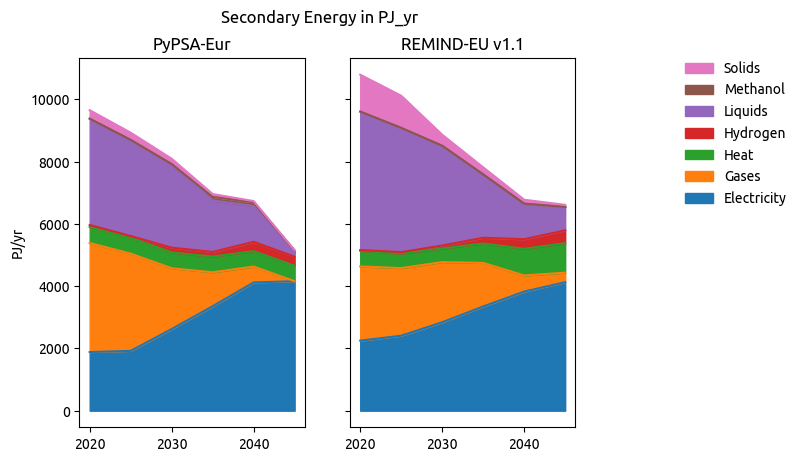 |
 |
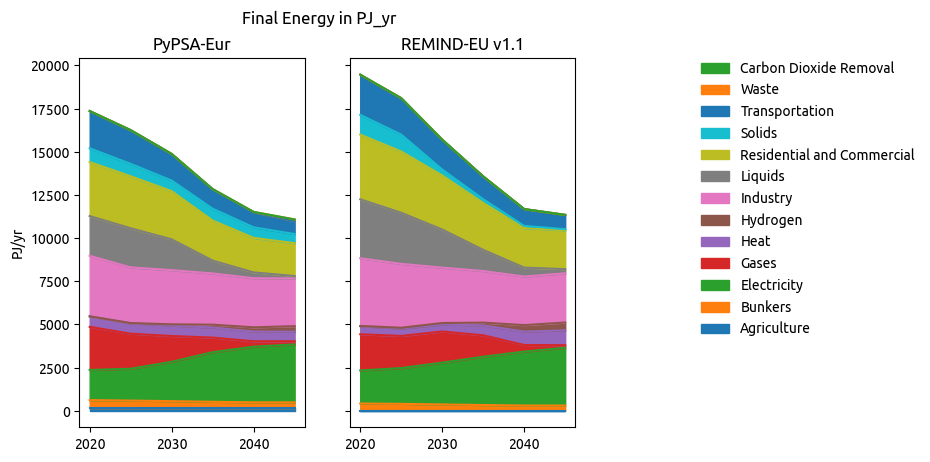 |
 |
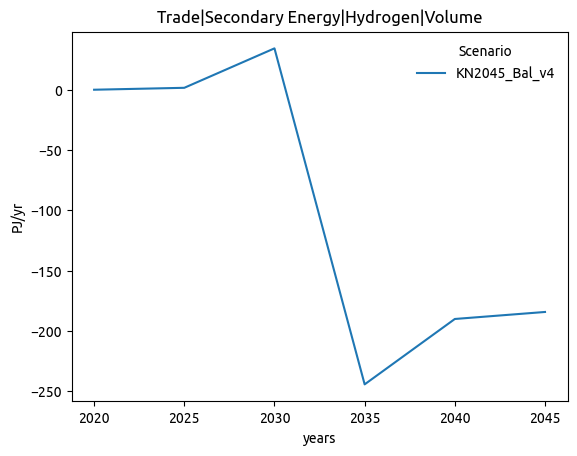 |
 |
 |
 |
 |
 |
Files comparison
| Status | NRMSE | MAE (norm) | |
|---|---|---|---|
| csvs/prices.csv | :warning:Changed | 0.001 | 0.06 |
| csvs/curtailment.csv | :warning:Changed | 0.000 | 0.13 |
| csvs/price_statistics.csv | :warning:Changed | 0.002 | 0.19 |
| csvs/cumulative_cost.csv | :warning:Changed | 0.000 | 0.20 |
| csvs/metrics.csv | :warning:Changed | 0.000 | 0.08 |
| csvs/nodal_cfs.csv | :white_check_mark: Almost equal | 0.009 | 0.00 |
| csvs/supply.csv | :white_check_mark: Almost equal | 0.001 | 0.01 |
| csvs/nodal_supply_energy.csv | :white_check_mark: Almost equal | 0.000 | 0.00 |
| csvs/capacities.csv | :white_check_mark: Almost equal | 0.000 | 0.01 |
| csvs/nodal_costs.csv | :white_check_mark: Almost equal | 0.000 | 0.00 |
| csvs/market_values.csv | :white_check_mark: Almost equal | 0.008 | 0.05 |
| csvs/nodal_capacities.csv | :white_check_mark: Almost equal | 0.000 | 0.00 |
| csvs/cfs.csv | :white_check_mark: Almost equal | 0.037 | 0.00 |
| csvs/costs.csv | :white_check_mark: Almost equal | 0.000 | 0.01 |
| csvs/supply_energy.csv | :white_check_mark: Almost equal | 0.000 | 0.02 |
| csvs/energy.csv | :white_check_mark: Almost equal | 0.000 | 0.01 |
| csvs/weighted_prices.csv | :white_check_mark: Equal |
Model Metrics
Benchmarks


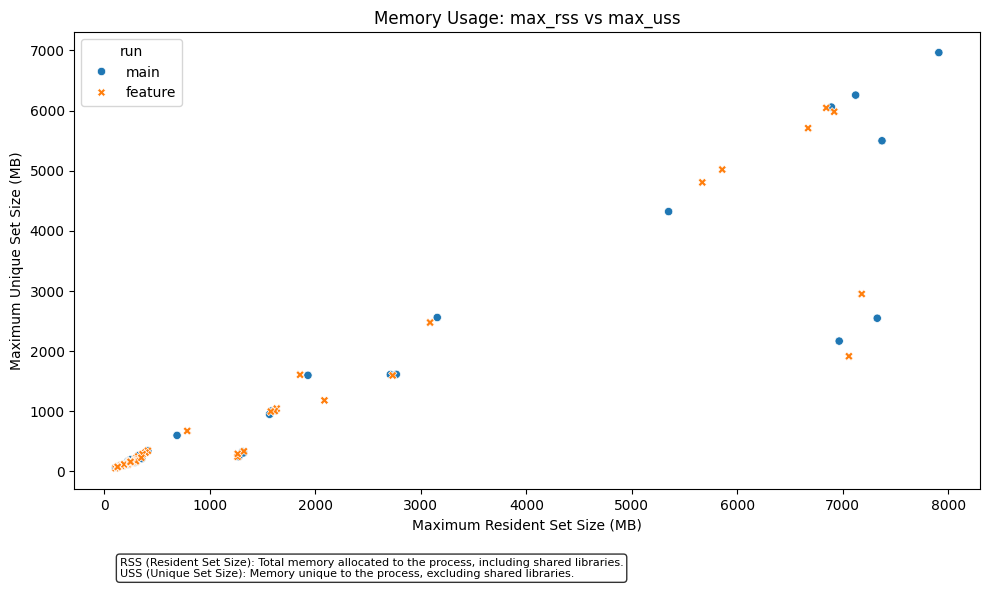
Comparing improve-NEP-plots (158aa54) with main (48ccaef).
Branch is 4 commits ahead and 1 commits behind.
Last updated on 2024-11-05 18:18:44 CET.
Before asking for a review for this PR make sure to complete the following checklist:
ariadne_allcompletes without errorsexport_ariadne_variableshas been adapted to the changesChangelog.mdmainhas been merged into the PRYYYYMMDDdescriptive_title