Validator Report
I am the Validator. Download all artifacts here. I'll be back and edit this comment for each new commit.
:warning: Config changes detected!
Results may differ due to these changes: ```diff diff --git a/config/config.yaml b/config/config.yaml index 52f5752..6ba1093 100644 --- a/config/config.yaml +++ b/config/config.yaml @@ -4,7 +4,7 @@ # docs in https://pypsa-eur.readthedocs.io/en/latest/configuration.html#run run: - prefix: 20241120-correct-wind + prefix: 20241113-export-kernnetz-invest name: # - CurrentPolicies @@ -104,9 +104,7 @@ atlite: renewable: onwind: - capacity_per_sqkm: 2 cutout: europe-2019-sarah3-era5 - correction_factor: 0.95 resource: smooth: false #this is false until correction to onshore wind speeds from GWA implemented #based on Vestas_V112_3MW, but changing hub_height from 80m with time @@ -130,7 +128,6 @@ renewable: capacity_per_sqkm: 6 landfall_length: 30 cutout: europe-2019-sarah3-era5 - correction_factor: 0.95 resource: smooth: true #based on NREL_ReferenceTurbine_2020ATB_5.5MW, but changing hub_height from 80m with time @@ -154,7 +151,6 @@ renewable: capacity_per_sqkm: 6 landfall_length: 30 cutout: europe-2019-sarah3-era5 - correction_factor: 0.95 resource: smooth: true #based on NREL_ReferenceTurbine_2020ATB_5.5MW, but changing hub_height from 80m with time @@ -178,13 +174,12 @@ renewable: landfall_length: 30 capacity_per_sqkm: 6 cutout: europe-2019-sarah3-era5 - correction_factor: 0.95 solar: cutout: europe-2019-sarah3-era5 - correction_factor: 0.9 # scaling to Abbildung 36 of https://www.ise.fraunhofer.de/de/veroeffentlichungen/studien/aktuelle-fakten-zur-photovoltaik-in-deutschland.html + correction_factor: 0.918 # scaling to Abbildung 36 of https://www.ise.fraunhofer.de/de/veroeffentlichungen/studien/aktuelle-fakten-zur-photovoltaik-in-deutschland.html solar-hsat: cutout: europe-2019-sarah3-era5 - correction_factor: 0.9 # scaling to Abbildung 36 of https://www.ise.fraunhofer.de/de/veroeffentlichungen/studien/aktuelle-fakten-zur-photovoltaik-in-deutschland.html + correction_factor: 0.918 # scaling to Abbildung 36 of https://www.ise.fraunhofer.de/de/veroeffentlichungen/studien/aktuelle-fakten-zur-photovoltaik-in-deutschland.html hydro: cutout: europe-2019-sarah3-era5 @@ -446,7 +441,7 @@ solving: DE: 2020: 7.8 2025: 11.3 - 2030: 29.3 # uba Projektionsbericht and NEP without delayed BalWin 3 + 2030: 31.3 # uba Projektionsbericht 2035: 70 2040: 70 2045: 70 ```Ariadne Variables
Comparison
| NRMSE | Pearson | |
|---|---|---|
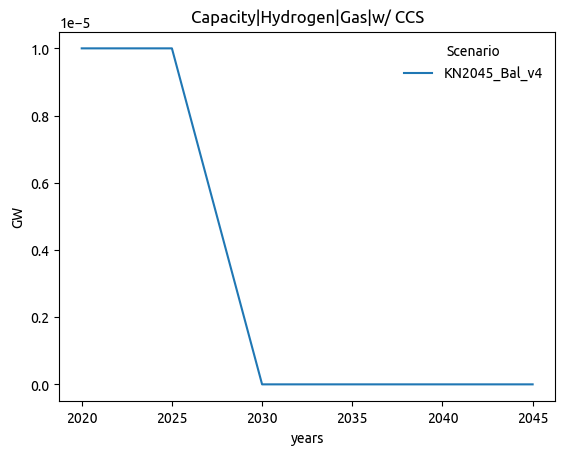
| Capacity|Hydrogen|Gas|w/ CCS | 0.816 | -1.000 |
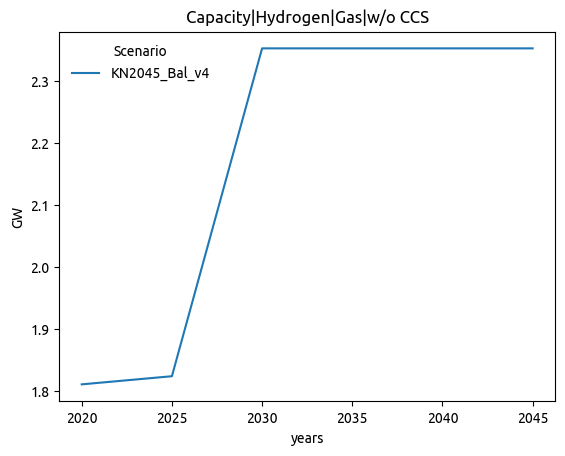
| Capacity|Hydrogen|Gas|w/o CCS | 0.797 | 0.644 |
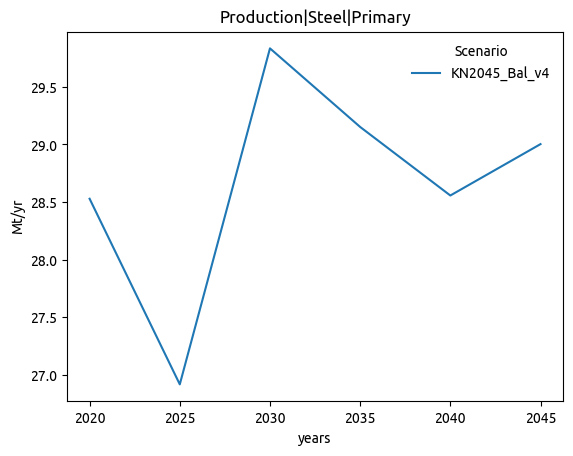
| Production|Steel|Primary | 0.673 | -0.115 |
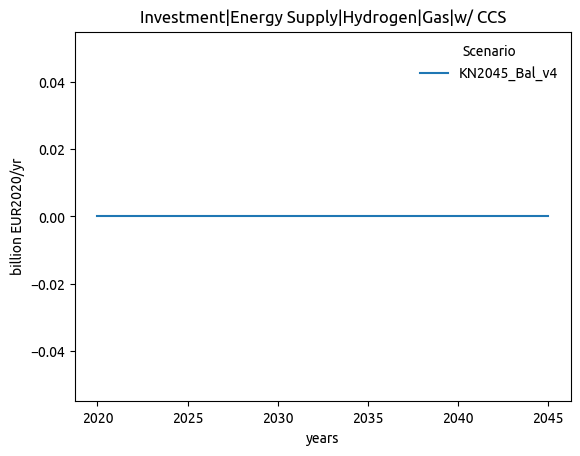
| Investment|Energy Supply|Hydrogen|Gas|w/ CCS | 0.577 | 0.000 |
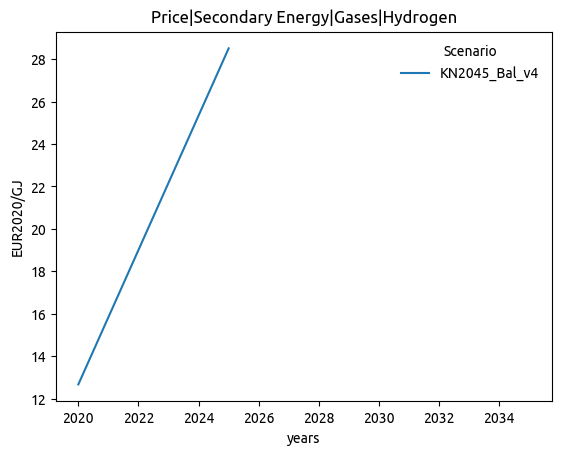
| Price|Secondary Energy|Gases|Hydrogen | 0.552 | 0.000 |
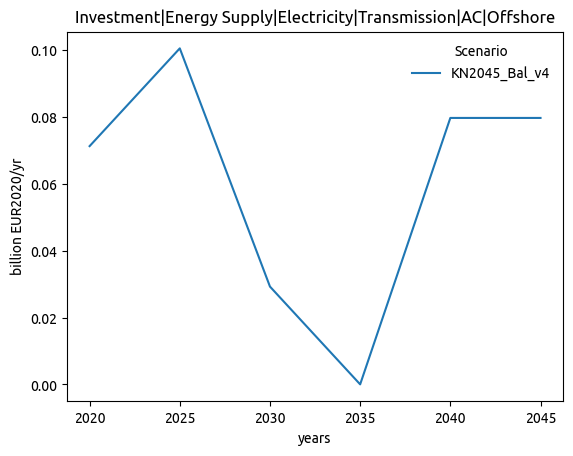
| Investment|Energy Supply|Electricity|Transmission|AC|Offshore | 0.486 | 0.533 |
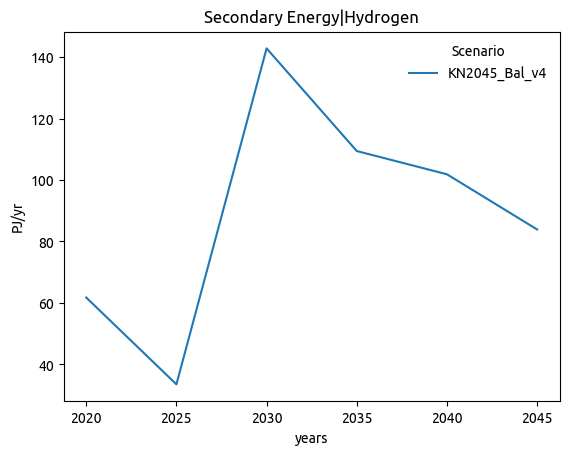
| Secondary Energy|Hydrogen | 0.454 | 0.435 |
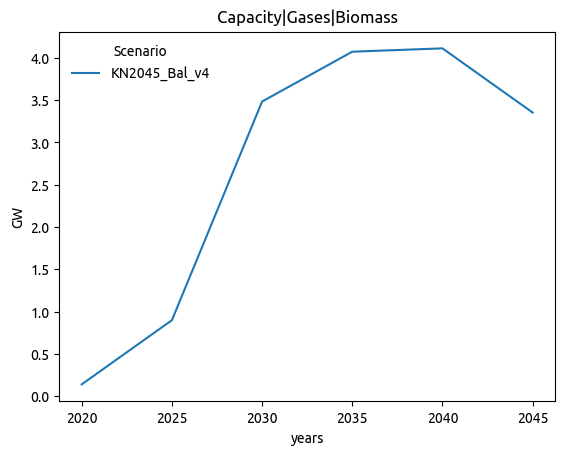
| Capacity|Gases|Biomass | 0.449 | 0.461 |
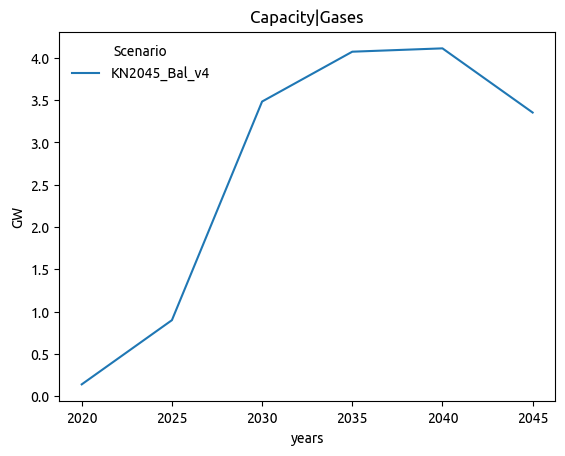
| Capacity|Gases | 0.449 | 0.461 |
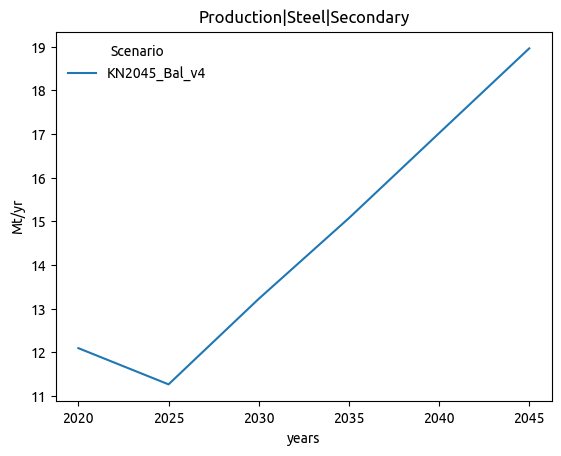
| Production|Steel|Secondary | 0.441 | 0.983 |
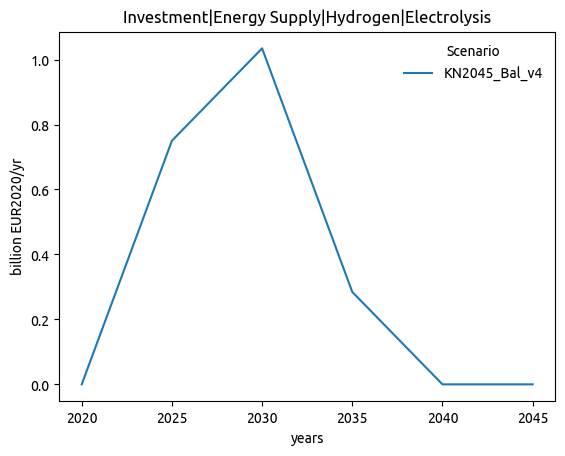
| Investment|Energy Supply|Hydrogen|Electrolysis | 0.439 | 0.465 |
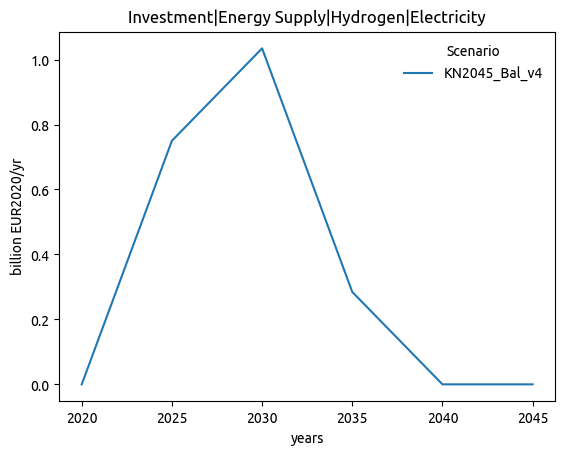
| Investment|Energy Supply|Hydrogen|Electricity | 0.439 | 0.465 |
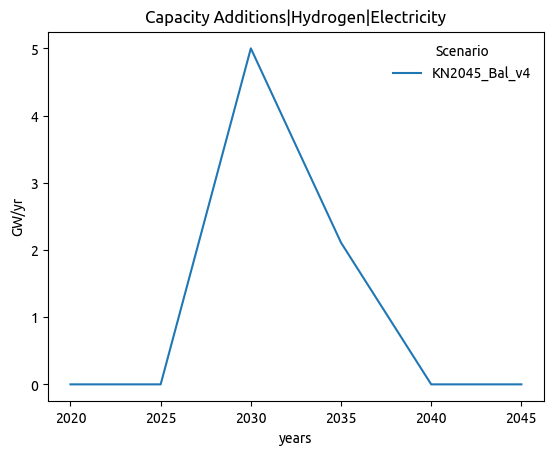
| Capacity Additions|Hydrogen|Electricity | 0.437 | 0.305 |
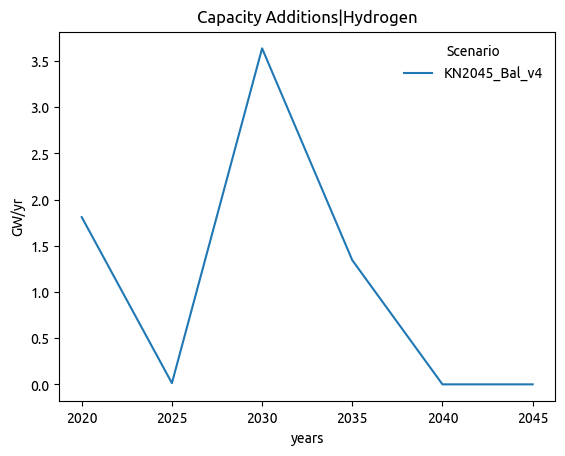
| Capacity Additions|Hydrogen | 0.436 | 0.209 |
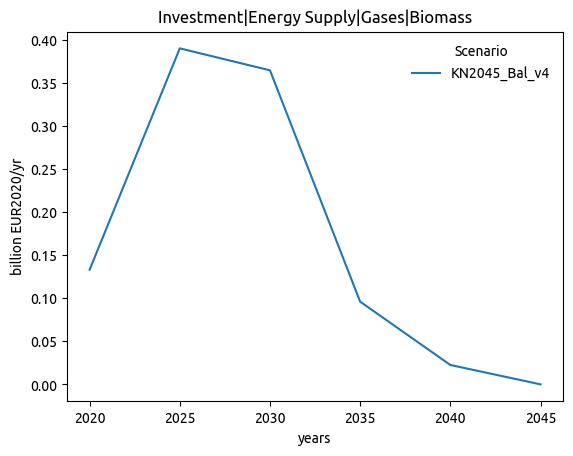
| Investment|Energy Supply|Gases|Biomass | 0.421 | 0.447 |
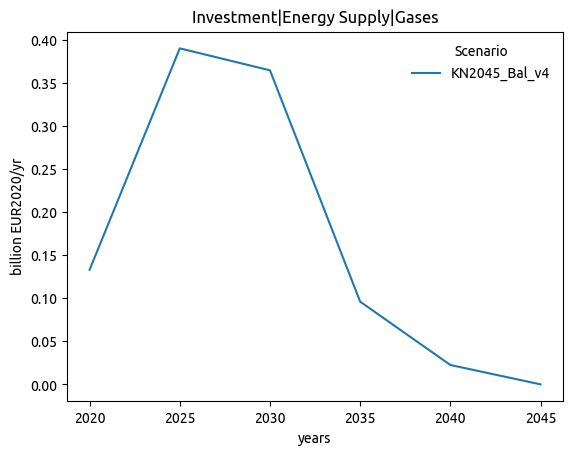
| Investment|Energy Supply|Gases | 0.421 | 0.447 |
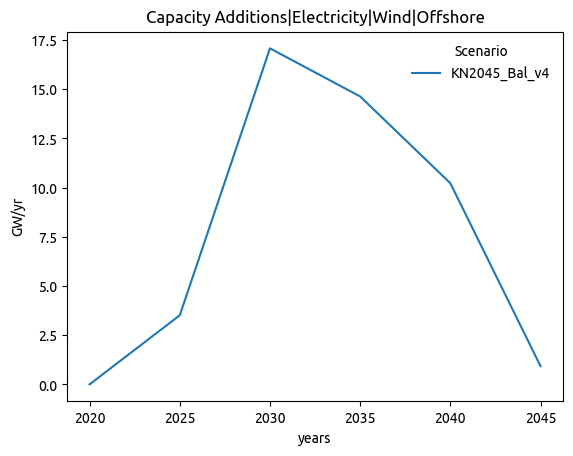
| Capacity Additions|Electricity|Wind|Offshore | 0.411 | 0.347 |
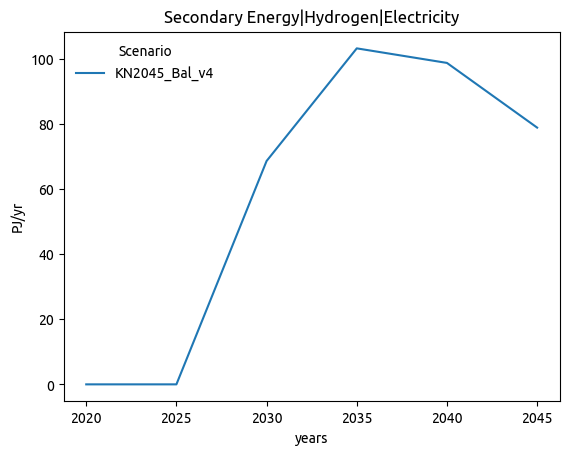
| Secondary Energy|Hydrogen|Electricity | 0.409 | 0.807 |
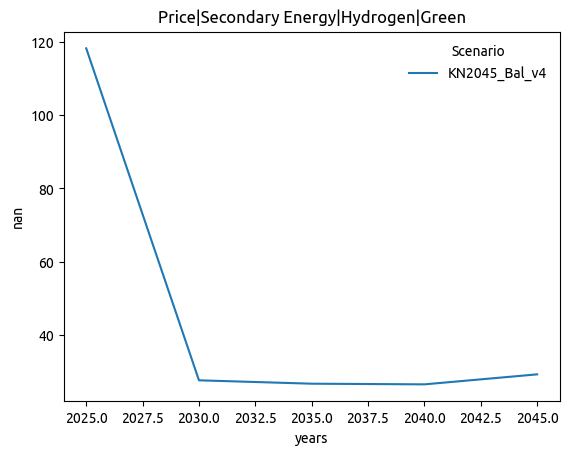
| Price|Secondary Energy|Hydrogen|Green | 0.409 | 0.000 |
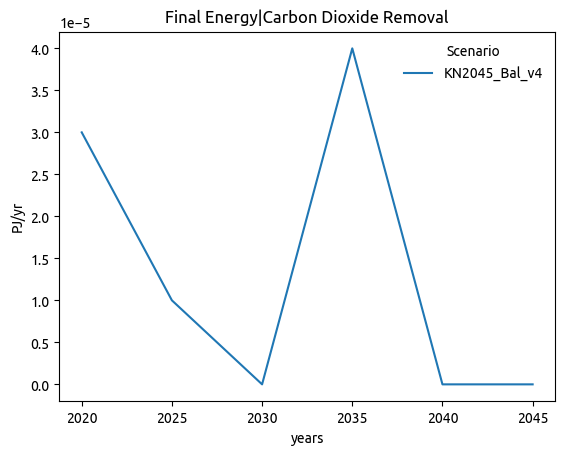
| Final Energy|Carbon Dioxide Removal | 0.408 | -0.373 |
| Final Energy|Carbon Dioxide Removal|Electricity | 0.408 | -0.415 |
| Carbon Sequestration|DACCS | 0.408 | -0.200 |
| Capacity Additions|Hydrogen|Gas|w/ CCS | 0.408 | -0.316 |
| Primary Energy|Biomass|Gases | 0.405 | 0.197 |
| Secondary Energy|Gases|Biomass | 0.405 | 0.197 |
| Secondary Energy Input|Electricity|Hydrogen | 0.405 | 0.811 |
| Capacity Additions|Gases|Biomass | 0.399 | 0.050 |
| Capacity Additions|Gases | 0.399 | 0.050 |
| Capacity Additions|Heat|Processes | 0.394 | 0.627 |
| Capacity|Hydrogen|Electricity | 0.386 | 0.873 |
| Capacity|Hydrogen | 0.375 | 0.874 |
| Investment|Energy Supply|Hydrogen | 0.374 | 0.668 |
| Primary Energy|Oil|Electricity | 0.372 | 0.590 |
| Price|Primary Energy|Oil | 0.371 | 0.000 |
| Secondary Energy|Electricity|Oil | 0.368 | 0.591 |
| Capacity|Electricity|Storage Converter | 0.360 | 0.531 |
| Price|Secondary Energy|Liquids|Hydrogen | 0.359 | 0.662 |
| Investment|Energy Supply|Heat|Processes | 0.356 | 0.707 |
| Price|Secondary Energy|Gases|Biomass | 0.356 | 0.631 |
| Investment|Energy Supply|Electricity|Wind|Offshore | 0.331 | 0.441 |
| Investment|Energy Supply|Electricity|Wind Offshore | 0.331 | 0.441 |
| Secondary Energy|Heat|Other | 0.317 | 0.892 |
| Capacity|Heat|Processes | 0.308 | 0.945 |
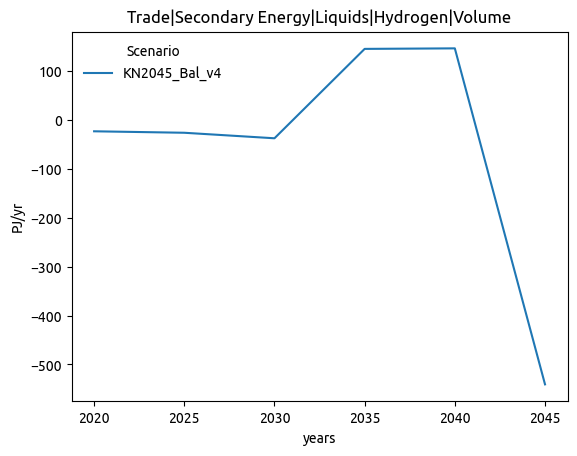
| Trade|Secondary Energy|Hydrogen|Volume | 0.300 | 0.903 |
| Investment|Energy Supply|Hydrogen|Transmission and Distribution|Endogen|Retrofitted | 0.295 | 0.710 |
| Investment|Energy Supply|Electricity|Non-Renewable Waste | 0.290 | 0.510 |
| Investment|Energy Supply|Heat|Non-Renewable Waste | 0.290 | 0.510 |
| Investment|Energy Supply|Electricity|Transmission|Offshore | 0.285 | 0.618 |
| Trade|Secondary Energy|Liquids|Biomass|Volume | 0.280 | 0.789 |
| Trade|Secondary Energy|Liquids|Biomass|Gross Import|Volume | 0.279 | 0.777 |
| Secondary Energy Input|Hydrogen|Heat | 0.270 | 1.000 |
| Secondary Energy|Heat|Hydrogen | 0.270 | 1.000 |
| Secondary Energy|Electricity|Hydrogen | 0.270 | 1.000 |
| Secondary Energy Input|Hydrogen|Electricity | 0.270 | 1.000 |
| Capacity|Electricity|Hydrogen|CC | 0.265 | 1.000 |
| Capacity|Heat|Hydrogen | 0.265 | 1.000 |
| Capacity|Electricity|Hydrogen | 0.265 | 1.000 |
| Investment|Energy Supply|Electricity|Hydrogen|CC | 0.265 | 1.000 |
| Investment|Energy Supply|Electricity|Hydrogen | 0.265 | 1.000 |
| Investment|Energy Supply|Heat|Hydrogen | 0.265 | 1.000 |
| Capacity Additions|Electricity|Non-Renewable Waste | 0.264 | 0.806 |
| Trade|Secondary Energy|Electricity|Volume | 0.263 | 0.670 |
| Secondary Energy|Heat|Electricity|Resistive | 0.261 | 0.863 |
| Capacity Additions|Heat|Non-Renewable Waste | 0.259 | 0.805 |
| Investment|Energy Supply|Electricity|Transmission|DC|Offshore | 0.256 | 0.724 |
| Capacity|Electricity|Transmission|AC | 0.248 | 0.980 |
| Capacity Additions|Electricity|Solar|PV|Open Field | 0.235 | 0.843 |
| Final Energy|Bunkers|Navigation|Liquids|Biomass | 0.233 | 0.836 |
| Final Energy|Industry excl Non-Energy Use|Liquids|Biomass | 0.233 | 0.810 |
| Final Energy|Transportation|Liquids|Biomass | 0.233 | 0.829 |
| Investment|Energy Supply|Electricity|Gas | 0.233 | 1.000 |
| Investment|Energy Supply|Electricity|Gas|w/o CCS | 0.233 | 1.000 |
| Final Energy|Liquids|Biomass | 0.233 | 0.830 |
| Final Energy|Residential and Commercial|Liquids|Biomass | 0.233 | 0.928 |
| Secondary Energy|Heat | 0.229 | 0.971 |
| Secondary Energy|Electricity|Wind|Offshore | 0.210 | 0.939 |
| Investment|Energy Supply|Heat|Gas | 0.208 | 0.992 |
| Capacity Additions|Hydrogen|Transmission|Endogenous | 0.207 | 0.845 |
| Capacity|Electricity|Gas|OC | 0.204 | 0.878 |
| Capacity Additions|Electricity|Transmission|AC | 0.204 | 0.927 |
| Length Additions|Electricity|Transmission|AC | 0.204 | 0.927 |
| Investment|Energy Supply|Electricity|Solar|PV|Open Field | 0.200 | 0.867 |
| Capacity Additions|Electricity|Transmission | 0.200 | 0.903 |
| Secondary Energy|Electricity|Hydro | 0.198 | 0.875 |
| Secondary Energy|Electricity|Wind|Onshore | 0.191 | 0.986 |
| Investment|Energy Supply|Heat | 0.189 | 0.933 |
| Capacity Additions|Electricity|Wind|Onshore | 0.189 | 0.879 |
| Capacity Additions|Electricity|Hydrogen|CC | 0.187 | 1.000 |
| Capacity Additions|Heat|Hydrogen | 0.187 | 1.000 |
| Capacity Additions|Electricity|Hydrogen | 0.187 | 1.000 |
| Capacity|Heat|Storage Reservoir | 0.186 | 1.000 |
| Capacity|Heat|Storage Converter | 0.186 | 1.000 |
| Capacity Additions|Heat|Storage Converter | 0.186 | 1.000 |
| Trade|Secondary Energy|Electricity|Gross Import|Volume | 0.181 | 0.890 |
| Secondary Energy|Heat|Oil | 0.181 | 0.923 |
| Secondary Energy|Electricity|Curtailment | 0.178 | 0.984 |
| Secondary Energy|Electricity|Biomass|Gaseous and Liquid | 0.175 | 0.000 |
| Primary Energy|Waste|Heat | 0.175 | 0.819 |
| Final Energy|Waste | 0.174 | 0.820 |
| Primary Energy|Waste | 0.174 | 0.820 |
| Secondary Energy|Heat|Waste | 0.174 | 0.820 |
| Primary Energy|Oil|Heat | 0.174 | 0.927 |
| Primary Energy|Waste|Electricity | 0.173 | 0.825 |
| Investment|Energy Supply|Electricity|Transmission|AC|Onshore | 0.172 | 0.972 |
| Secondary Energy|Electricity|Waste | 0.172 | 0.827 |
| Capacity|Electricity|Wind|Offshore | 0.165 | 0.945 |
| Capacity Additions|Electricity|Gas | 0.165 | 1.000 |
| Capacity Additions|Electricity|Gas|w/o CCS | 0.165 | 1.000 |
| Investment|Energy Supply|Electricity|Transmission|DC | 0.163 | 0.911 |
| Primary Energy|Biomass|Electricity | 0.159 | 0.944 |
| Investment|Energy Supply|Electricity|Wind|Onshore | 0.157 | 0.952 |
| Investment|Energy Supply|Electricity|Wind Onshore | 0.157 | 0.952 |
| Price|Secondary Energy|Hydrogen | 0.152 | 0.954 |
| Trade|Secondary Energy|Hydrogen|Gross Import|Volume | 0.151 | 0.974 |
| Investment|Energy Supply|Heat|Storage Reservoir | 0.149 | 1.000 |
| Capacity|Electricity|Wind|Onshore | 0.143 | 0.988 |
| Capacity Additions|Heat|Storage Reservoir | 0.140 | 1.000 |
| Capacity|Heat|Resistive heater | 0.136 | 0.989 |
| Capacity|Electricity|Non-Renewable Waste | 0.134 | 0.921 |
| Capacity|Heat|Non-Renewable Waste | 0.133 | 0.919 |
| Capacity Additions|Electricity|Wind | 0.133 | 0.948 |
| Capacity|Electricity|Transmission | 0.131 | 0.986 |
| Trade|Secondary Energy|Gases|Biomass|Volume | 0.126 | 0.957 |
| Investment|Energy Supply|Hydrogen|Transmission and Distribution|Endogen|New-build | 0.122 | 0.954 |
| Investment|Energy Supply|Electricity|Transmission | 0.122 | 0.955 |
| Capacity Additions|Hydrogen|Gas|w/o CCS | 0.119 | 0.957 |
| Capacity Additions|Heat|Resistive heater | 0.119 | 0.953 |
| Capacity Additions|Electricity|Solar | 0.117 | 0.946 |
| Capacity Additions|Electricity|Solar|PV | 0.117 | 0.946 |
| Investment|Energy Supply|Heat|Resistive heater | 0.117 | 0.972 |
| Primary Energy|Hydro | 0.112 | 0.982 |
| Secondary Energy|Electricity|Storage Losses | 0.109 | 0.983 |
| Capacity Additions|Heat|Gas | 0.108 | 0.941 |
| Emissions|CO2|Efuels|Liquids | 0.103 | 0.967 |
| Price|Final Energy|Residential and Commercial|Gases | 0.102 | 0.960 |
| Investment|Energy Supply|Electricity|Transmission|AC | 0.100 | 0.979 |
| Trade|Secondary Energy|Gases|Biomass|Gross Import|Volume | 0.100 | 1.000 |
Plots
| Main branch | Feature branch |
|---|---|
 |
 |
 |
 |
 |
 |
 |
 |
 |
 |
 |
 |
 |
 |
 |
 |
 |
 |
 |
 |
 |
 |
 |
 |
 |
 |
 |
 |
 |
 |
 |
 |
 |
 |
 |
 |
 |
 |
 |
 |
General
Plots comparison
| Main branch | Feature branch |
|---|---|
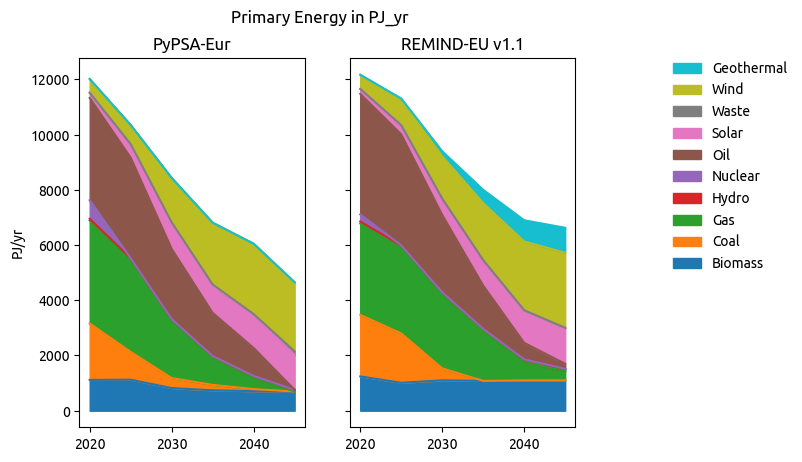 |
 |
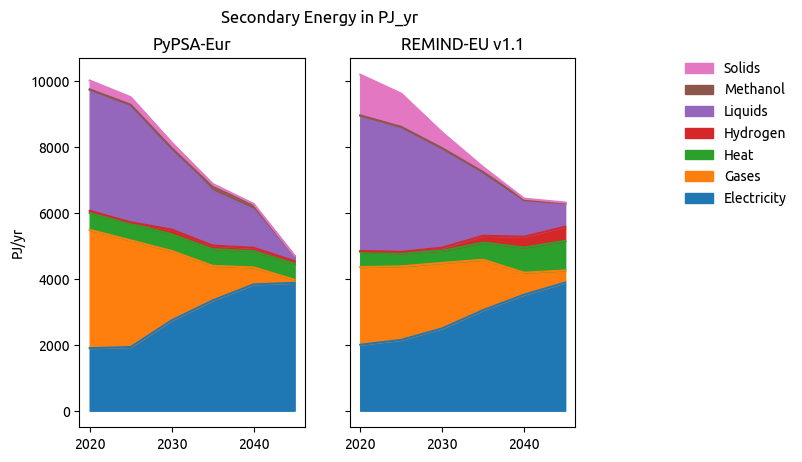 |
 |
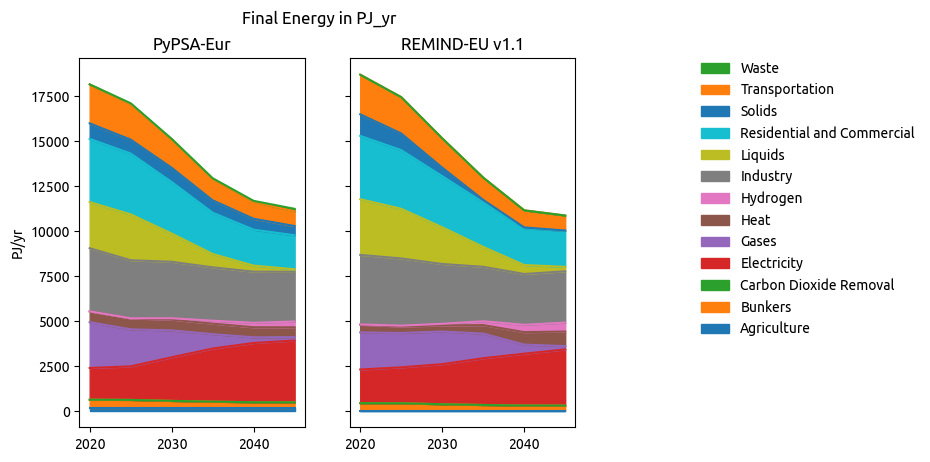 |
 |
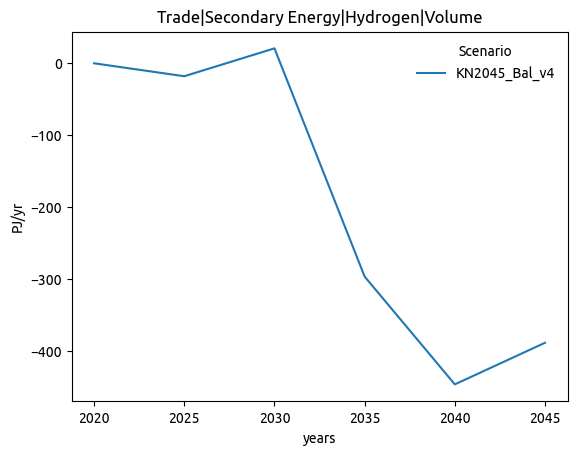 |
 |
 |
 |
 |
 |
Files comparison
| Status | NRMSE | MAE (norm) | |
|---|---|---|---|
| csvs/prices.csv | :warning:Changed | 0.006 | 0.15 |
| csvs/market_values.csv | :warning:Changed | 0.055 | 0.06 |
| csvs/price_statistics.csv | :warning:Changed | 0.045 | 0.33 |
| csvs/cumulative_cost.csv | :warning:Changed | 0.002 | 0.09 |
| csvs/metrics.csv | :warning:Changed | 0.004 | 0.09 |
| csvs/curtailment.csv | :warning:Changed | 0.000 | 0.13 |
| csvs/nodal_capacities.csv | :warning: NaN mismatch | ||
| csvs/nodal_cfs.csv | :warning: NaN mismatch | ||
| csvs/nodal_costs.csv | :warning: NaN mismatch | ||
| csvs/capacities.csv | :white_check_mark: Almost equal | 0.000 | 0.01 |
| csvs/supply.csv | :white_check_mark: Almost equal | 0.003 | 0.01 |
| csvs/nodal_supply_energy.csv | :white_check_mark: Almost equal | 0.000 | 0.00 |
| csvs/cfs.csv | :white_check_mark: Almost equal | 0.040 | 0.00 |
| csvs/costs.csv | :white_check_mark: Almost equal | 0.002 | 0.01 |
| csvs/supply_energy.csv | :white_check_mark: Almost equal | 0.002 | 0.01 |
| csvs/energy.csv | :white_check_mark: Almost equal | 0.003 | 0.01 |
| csvs/weighted_prices.csv | :white_check_mark: Equal |
Model Metrics
Benchmarks


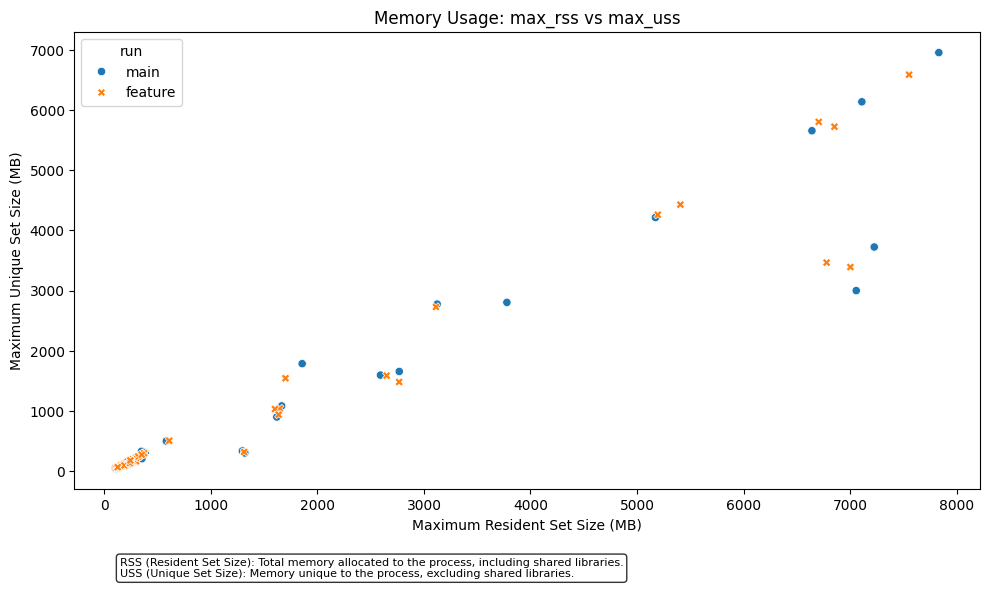
Comparing memory-efficiency-ariadne-report (9801a1e) with main (7b0dce4).
Branch is 5 commits ahead and 2 commits behind.
Last updated on 2024-11-21 13:12:40 CET.
Before asking for a review for this PR make sure to complete the following checklist:
ariadne_allcompletes without errorsexport_ariadne_variableshas been adapted to the changesChangelog.mdmainhas been merged into the PRYYYYMMDDdescriptive_title