 emmats
commented
7 years ago
emmats
commented
7 years ago What is the range? I would go pretty high with the cut-off. Your replicates should be right on top of each other. Maybe have @laurahspencer run the same script and figure out what her range of R2 values are? Off the cuff, I would say cut-off should be at least 0.85.
 yaaminiv
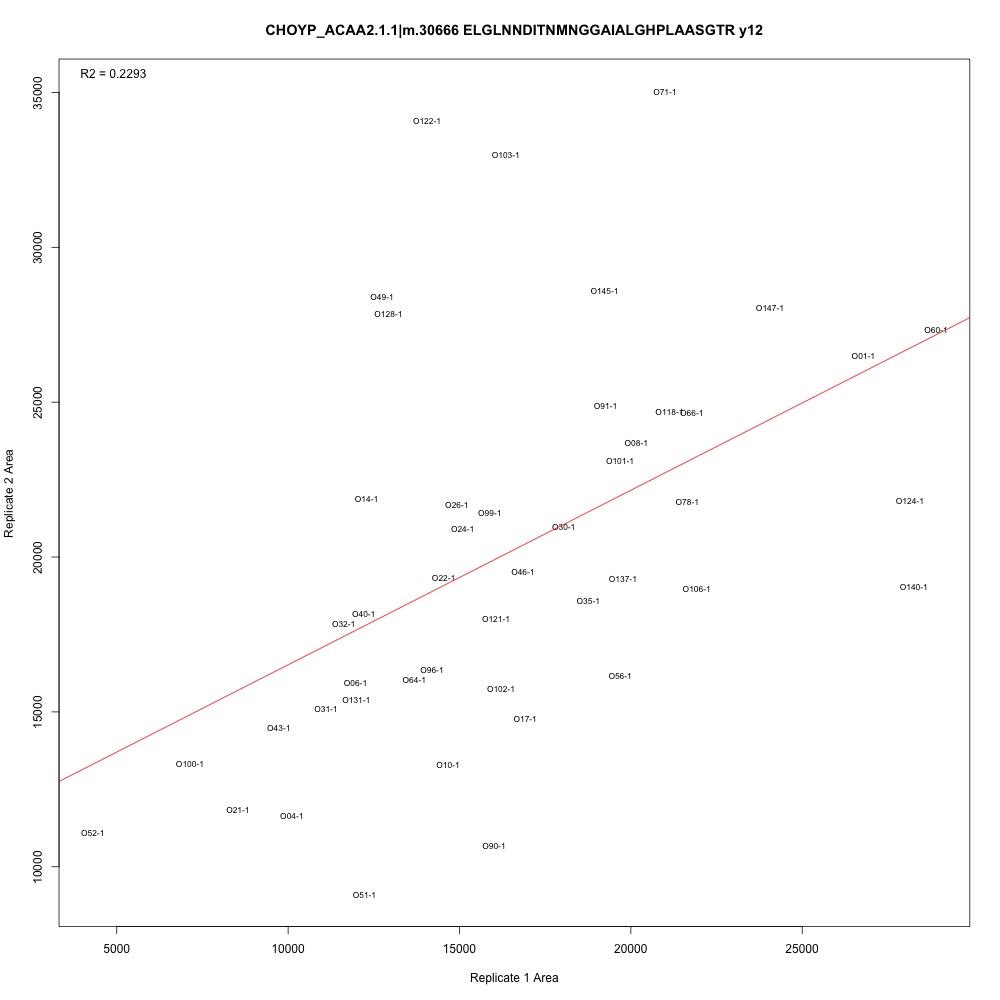
 sr320
sr320 laurahspencer
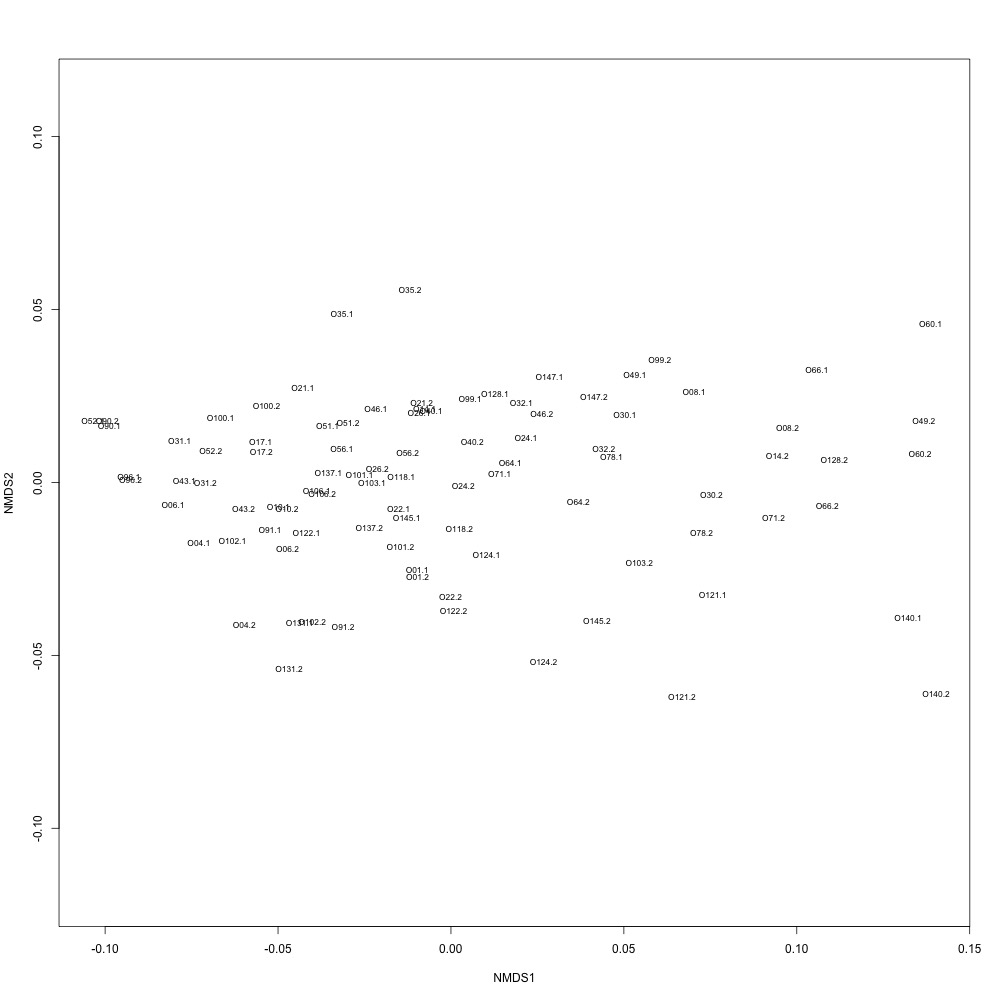
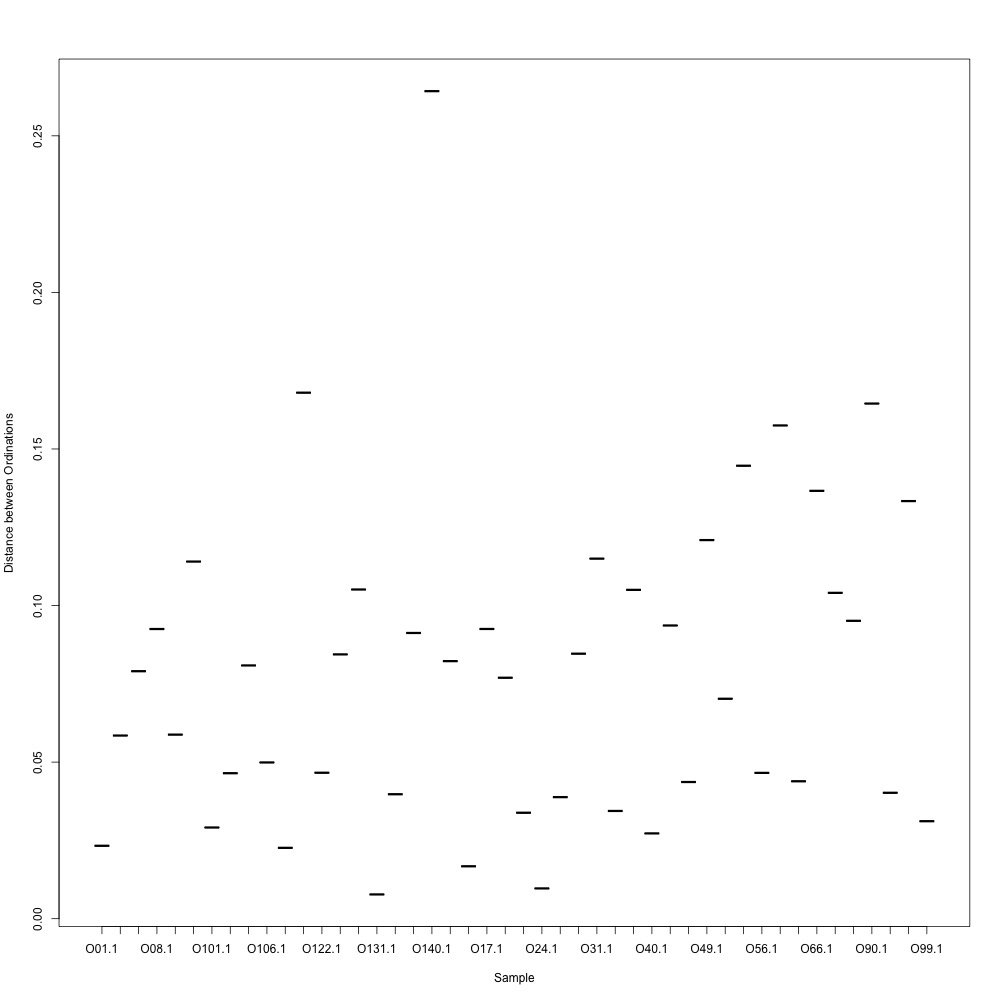
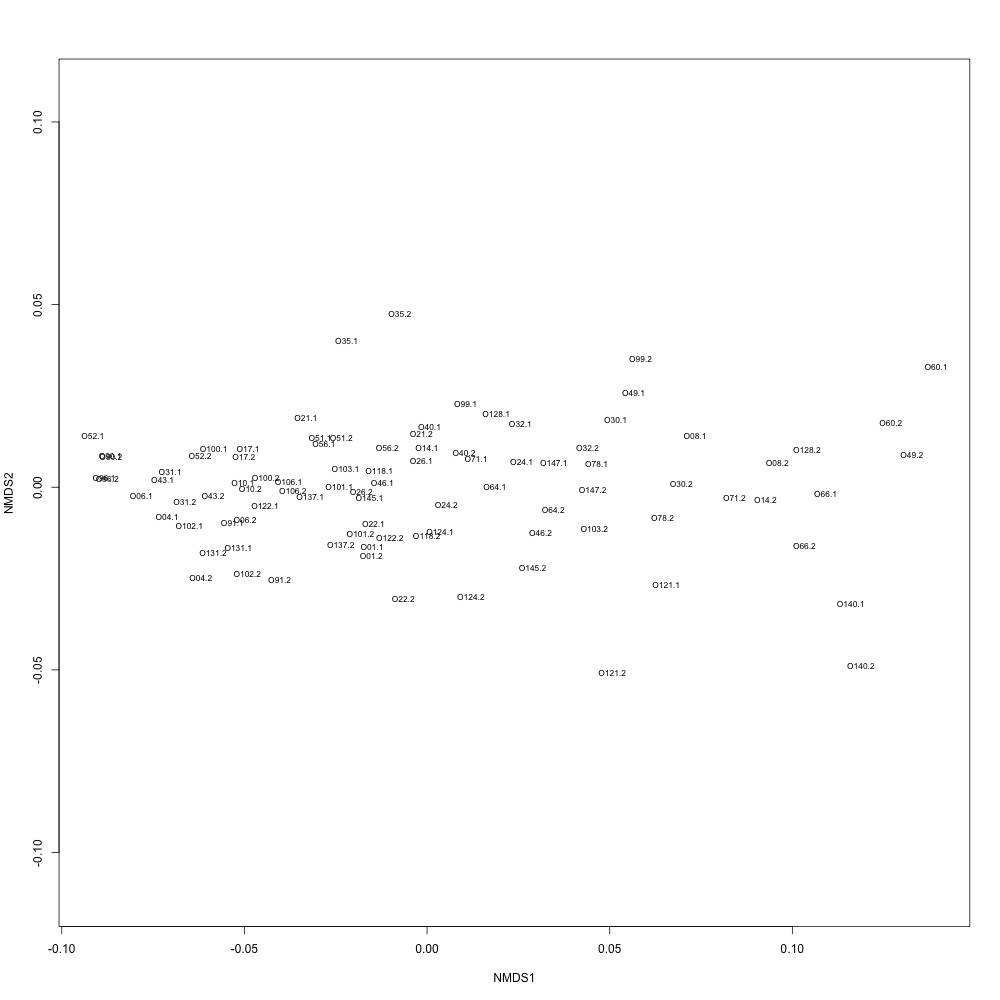
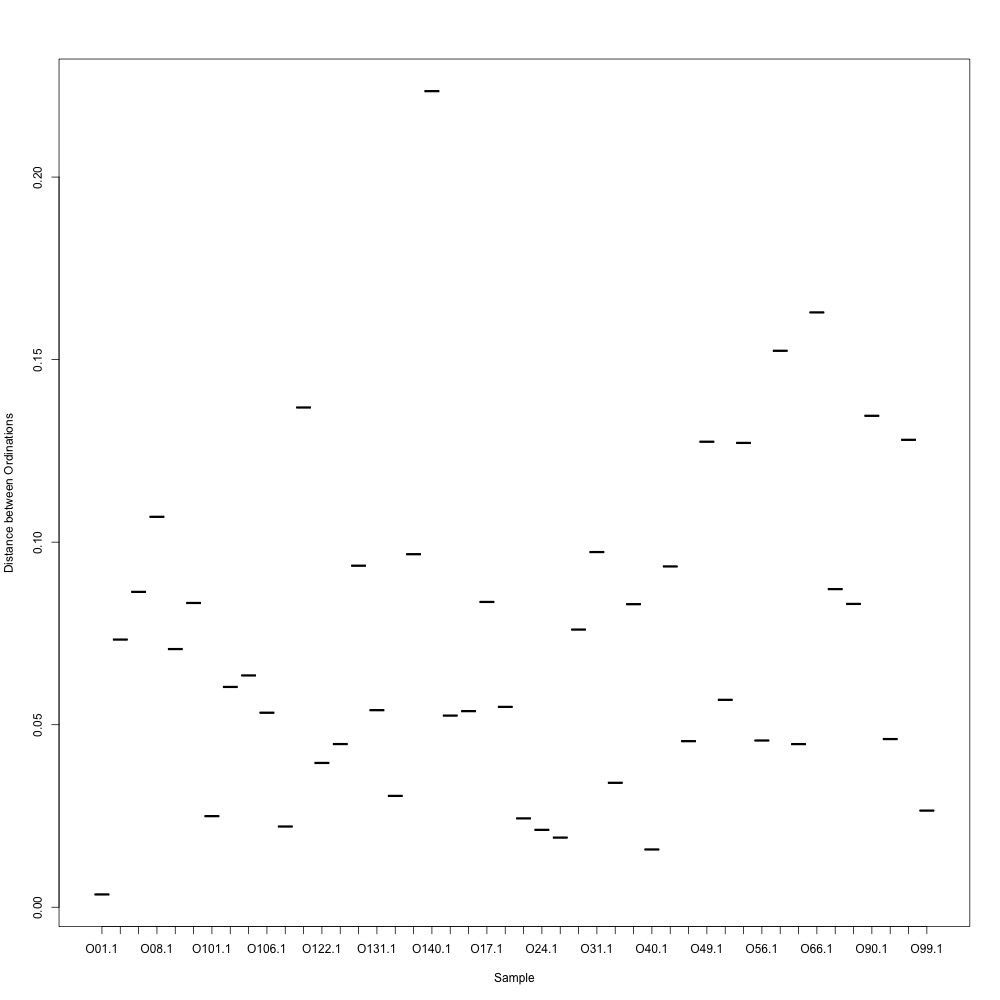
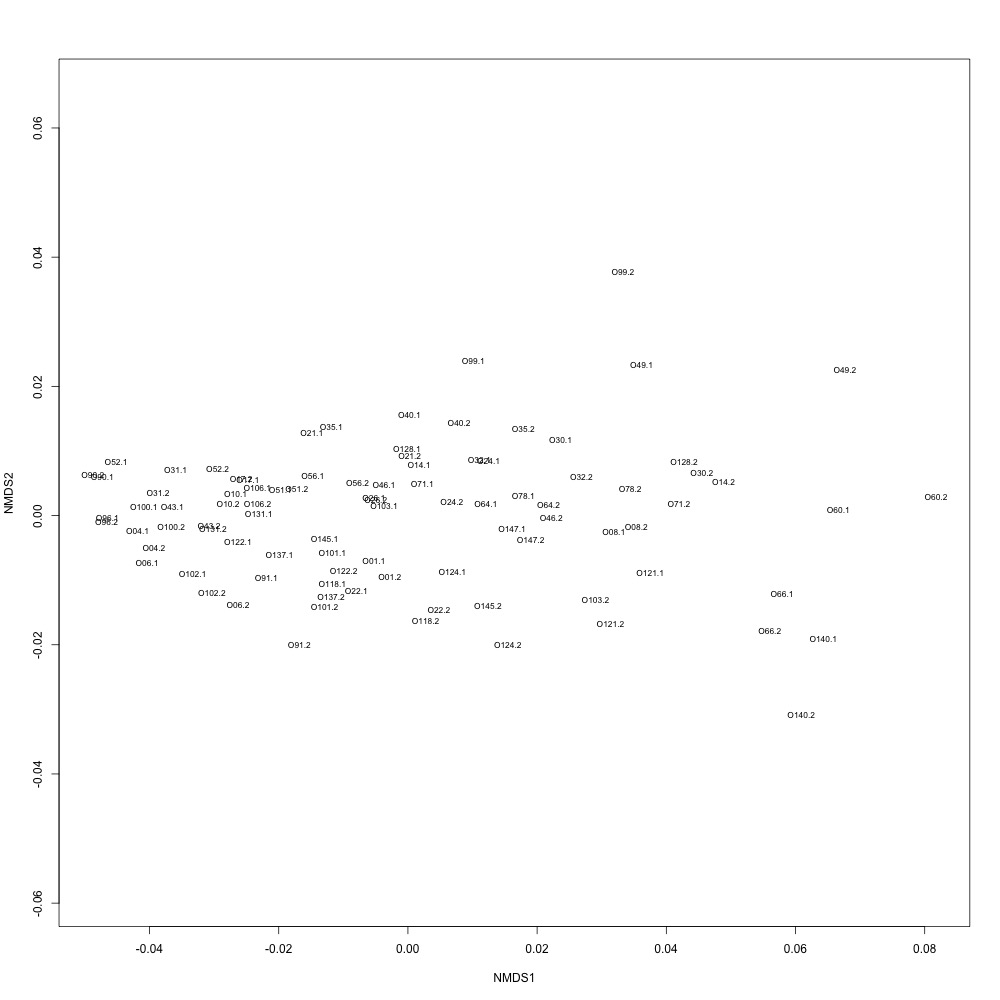
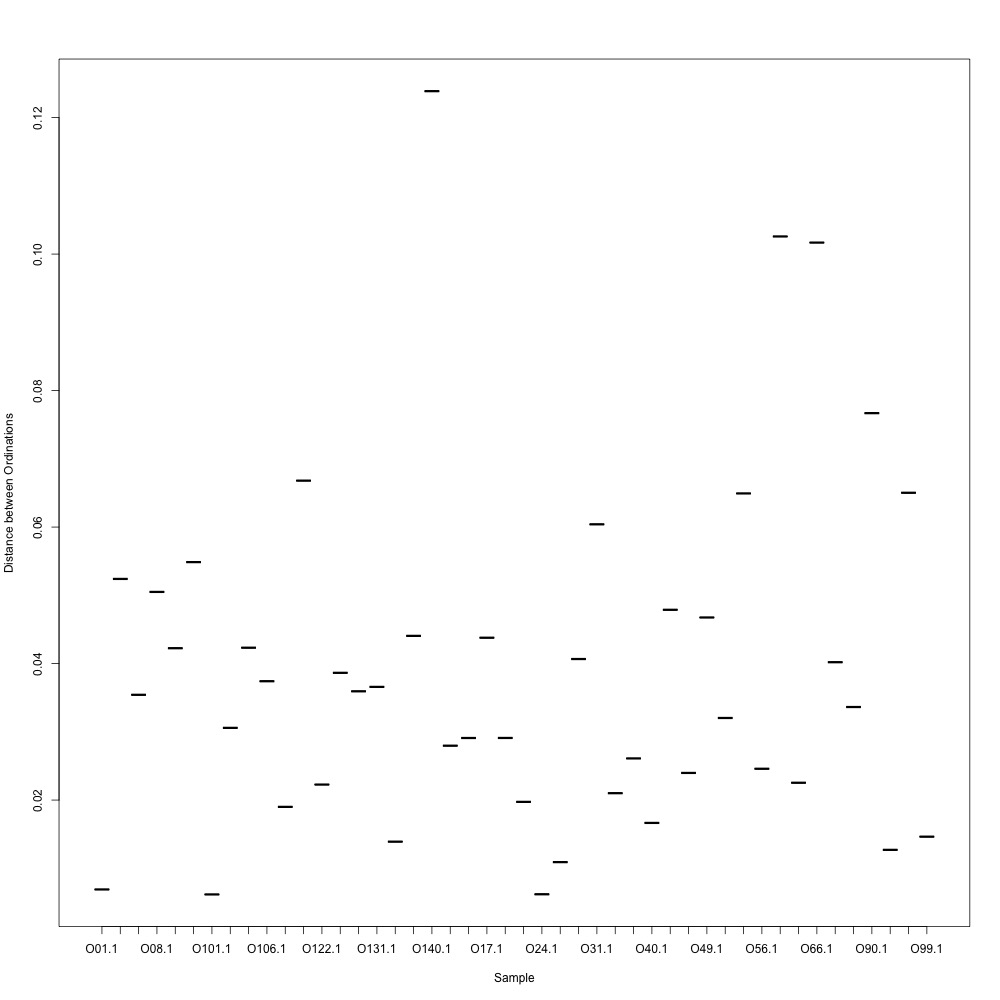
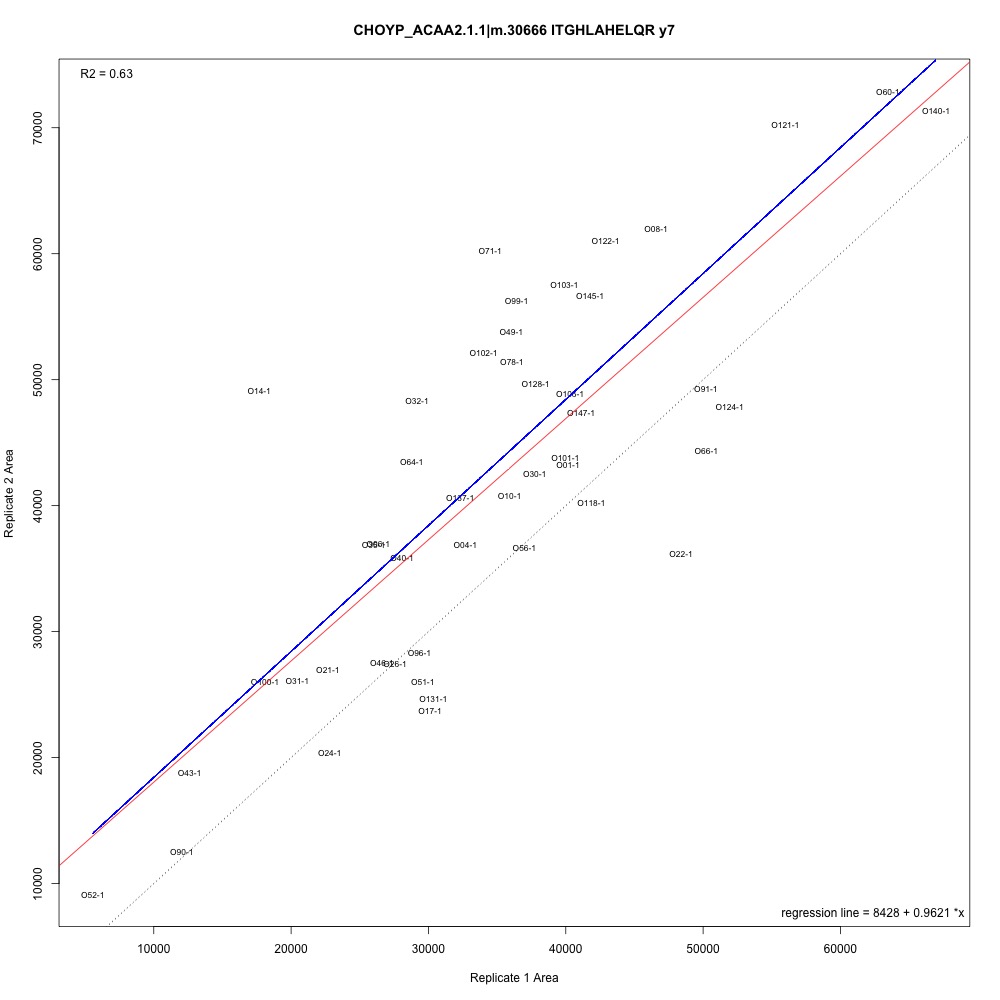

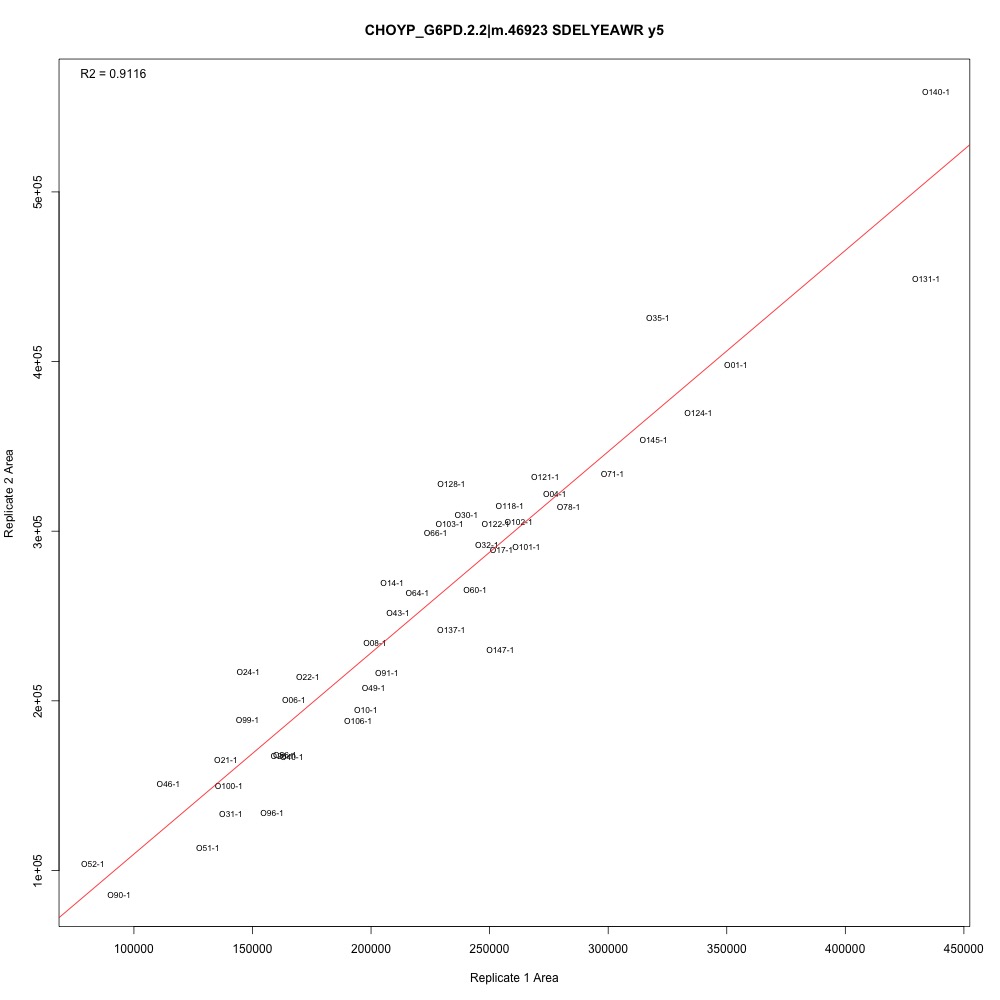
As @emmats suggested, I regressed my technical replicates against each other for each transition to see if some transitions were messier than others. You can see my work in my lab notebook entry.
There are definitely some transitions with lower adjusted R squared values than others. My first instinct is to establish some sort of R-squared cutoff, remove transitions lower than this cutoff, and then remake my NMDS plot. While I'm going through each transition, I can also see if there are certain outliers or leverage points that could be influencing the R-squared values (for those close to the cutoff).
Any suggestions for what that cutoff should be?