Here is file with GO information https://d.pr/f/TVZROq
Closed sr320 closed 5 years ago
Here is file with GO information https://d.pr/f/TVZROq
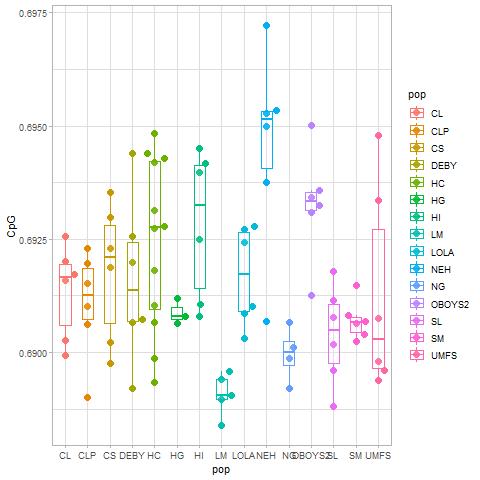
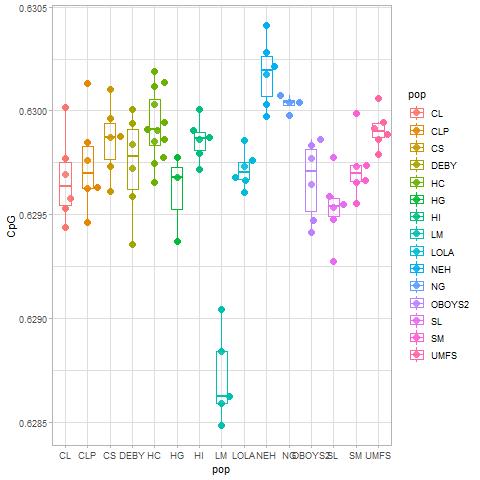
For the plots below:
Note that both graphs below will have the same number of points because the points are the samples/populations, and there are always 90 samples. The number of values represented underneath the points, e.g., the genes, is what changes between the "all samples" and "stress response" plots.
 All genes= left column
Stress genes= right column
 All genes plot.
 Stress response plot. Only genes that merged to stress response in the GO information file are represented here.
I can easily put genes on the x-axis instead of samples. I just wasn't sure what would be more valuable. If the samples represent the same treatment, population, or replicates then I think genes on the x axis makes more sense. However, if the question is what differences are occurring between samples/populations/etc. than samples on the x-axis would probably make more sense.
Samples/populations should be on the x axis because there are over 39k genes (or in the case of stress response ~3k) and that would be illegible.
Edit: Misunderstood what values were represented in the original dataset- corrected explanations.
Can you give me a list of stress genes where I could pick one and you could plot the CpG O/E for that for all 91 samples?
I just want to clarify- are rows or columns samples?
columns - 90
thanks Steven On Mar 20, 2019, 2:45 PM -0700, Kaitlyn Mitchell notifications@github.com, wrote:
I just want to clarify- are rows or columns samples? — You are receiving this because you authored the thread. Reply to this email directly, view it on GitHub, or mute the thread.
So the rows are genes? When making the graphs I assumed that the columns were genes and rows were sample because the columns were names of genes, but I can update the description.
Yes
thanks Steven
Steven B. Roberts Kenneth K. Chew Endowed Professor School of Aquatic and Fishery Sciences University of Washington, Seattle WA sr320@uw.edu - 206.866.5141 robertslab.info - @sr320 On Mar 20, 2019, 3:56 PM -0700, Kaitlyn Mitchell notifications@github.com, wrote:
So the rows are genes? When making the graphs I assumed that the columns were genes and rows were sample because the columns were names of genes, but I can update the description. — You are receiving this because you authored the thread. Reply to this email directly, view it on GitHub, or mute the thread.
How about a swarm plot of CpG OE of all stress response genes for all samples
This is on stress genes.
I used three graphs to distinguish differences between the population: density, box and swarm plots


Could you also plot on with these GO ID
GO:0100044  negative regulation of cellular hyperosmotic salinity response by transcription from RNA polymerase II promoter
GO:0042538  hyperosmotic salinity response
GO:0042539  hypotonic salinity response
GO:1900464  negative regulation of cellular hyperosmotic salinity response by negative regulation of transcription from RNA polymerase II promoter
GO:1900069  regulation of cellular hyperosmotic salinity response
GO:1900070  negative regulation of cellular hyperosmotic salinity response
GO:0071477  cellular hypotonic salinity response
GO:0071475  cellular hyperosmotic salinity response
GO:1902074  response to salt
GO:1902075  cellular response to salt
GO:0009651  response to salt stress
GO:1901000  regulation of response to salt stress
GO:1901002  positive regulation of response to salt stress
GO:1901001  negative regulation of response to salt stress
GO:1901200  negative regulation of calcium ion transport into cytosol involved in cellular response to salt stress
GO:1901196  positive regulation of calcium-mediated signaling involved in cellular response to salt stress
GO:1901199  positive regulation of calcium ion transport into cytosol involved in cellular response to salt stress
GO:0071472 cellular response to salt stressAnd separately these GO IDs
GO:0070415  trehalose metabolism in response to cold stress
GO:0070414  trehalose metabolism in response to heat stress
GO:0090441  trehalose biosynthesis in response to heat stress
GO:0090442  trehalose catabolism in response to heat stress
GO:0061408  positive regulation of transcription from RNA polymerase II promoter in response to heat stress
GO:1990845  adaptive thermogenesis
GO:0031990  mRNA export from nucleus in response to heat stress
GO:0043620  regulation of DNA-templated transcription in response to stress
GO:0043555  regulation of translation in response to stress
GO:1990611  regulation of cytoplasmic translational initiation in response to stress
GO:1990497  regulation of cytoplasmic translation in response to stress
GO:0034605  cellular response to heat
GO:0070417  cellular response to cold
GO:0006950  response to stress
GO:0036003  positive regulation of transcription from RNA polymerase II promoter in response to stress
GO:0043618  regulation of transcription from RNA polymerase II promoter in response to stress
GO:0080134  regulation of response to stress
GO:0080135  regulation of cellular response to stress
GO:0097201  negative regulation of transcription from RNA polymerase II promoter in response to stress
GO:0033554  cellular response to stress
GO:0033555  multicellular organismal response to stress
GO:0009271 phage shockand
GO:0045087  innate immune response
GO:0061760  antifungal innate immune response
GO:0045088  regulation of innate immune response
GO:0002218  activation of innate immune response
GO:0002227  innate immune response in mucosa
GO:1905036  positive regulation of antifungal innate immune response
GO:1905035  negative regulation of antifungal innate immune response
GO:1905034  regulation of antifungal innate immune response
GO:0035420  MAPK cascade involved in innate immune response
GO:0045824  negative regulation of innate immune response
GO:0045089  positive regulation of innate immune response
GO:0002758  innate immune response-activating signal transduction
GO:0002766  innate immune response-inhibiting signal transduction
GO:0090714  innate immunity memory response
GO:0035419  activation of MAPK activity involved in innate immune response
GO:0035423  inactivation of MAPK activity involved in innate immune response
GO:0035422  activation of MAPKKK activity involved in innate immune response
GO:0035421  activation of MAPKK activity involved in innate immune response
GO:0046735  passive induction of host innate immune response by virus
GO:0046738  active induction of innate immune response in host by virus
GO:0038075  MAP kinase activity involved in innate immune response
GO:0039503  suppression by virus of host innate immune response
GO:0052170  negative regulation by symbiont of host innate immune response
GO:0052166  positive regulation by symbiont of host innate immune response
GO:0052167  modulation by symbiont of host innate immune response
GO:0052390  induction by symbiont of host innate immune response
GO:0052305  positive regulation of innate immune response in other organism
GO:0052309  negative regulation of innate immune response in other organism
GO:0002220  innate immune response activating cell surface receptor signaling pathway
GO:0038078  MAP kinase phosphatase activity involved in regulation of innate immune response
GO:0052157  modulation by symbiont of microbe-associated molecular pattern-induced host innate immune response
GO:0052169  pathogen-associated molecular pattern dependent modulation by symbiont of host innate immune response
GO:0052033  pathogen-associated molecular pattern dependent induction by symbiont of host innate immune response
GO:0052034  negative regulation by symbiont of microbe-associated molecular pattern-induced host innate immune response
GO:0052382  induction by organism of innate immune response in other organism involved in symbiotic interaction
GO:0052306  modulation by organism of innate immune response in other organism involved in symbiotic interaction
GO:0052308  pathogen-associated molecular pattern dependent modulation by organism of innate immune response in other organism involved in symbiotic interaction
GO:0052258  negative regulation by organism of pathogen-associated molecular pattern-induced innate immune response of other organism involved in symbiotic interaction
GO:0052257  pathogen-associated molecular pattern dependent induction by organism of innate immune response of other organism involved in symbiotic interaction
GO:0052296  modulation by organism of microbe-associated molecular pattern-induced innate immune response in other organism involved in symbiotic interaction
GO:0035663  Toll-like receptor 2 binding
GO:0035662  Toll-like receptor 4 binding
GO:0090644  age-related resistance
GO:0035325  Toll-like receptor binding
GO:0039699  viral mRNA cap methylation
GO:0046696  lipopolysaccharide receptor complex
GO:0002224  toll-like receptor signaling pathway
GO:0039539  suppression by virus of host MDA-5 signaling pathway
GO:0039538  suppression by virus of host RIG-I signaling pathway
GO:0039537  suppression by virus of host viral-induced cytoplasmic pattern recognition receptor signaling pathway
GO:0039560  suppression by virus of host IRF9 activity
GO:1990231  STING complex
GO:0002755  MyD88-dependent toll-like receptor signaling pathway
GO:0002756  MyD88-independent toll-like receptor signaling pathway
GO:0035669  TRAM-dependent toll-like receptor 4 signaling pathway
GO:0035668  TRAM-dependent toll-like receptor signaling pathway
GO:0035667  TRIF-dependent toll-like receptor 4 signaling pathway
GO:0035666  TRIF-dependent toll-like receptor signaling pathway
GO:0035661  MyD88-dependent toll-like receptor 2 signaling pathway
GO:0035660  MyD88-dependent toll-like receptor 4 signaling pathway
GO:0035665  TIRAP-dependent toll-like receptor 4 signaling pathway
GO:0035664  TIRAP-dependent toll-like receptor signaling pathway


http://gannet.fish.washington.edu/Atumefaciens/20190225_cpg_oe/ID_CpG_labelled_all