 danielpeter
commented
5 years ago
danielpeter
commented
5 years ago hi Wenjie,
for Titan, we see that the strong scaling falls off at about 500MB per process. thus, with NEX = 256 we will have 4GB per process on a 24 process simulation / 1GB for 96 processes / ~300 MB for 384 processes. at that time we should see the communication kicking in. so, strong scaling can easily be investigated with 3 simple simulations only.
also, setting NEX = 256 will tell you what NPROC_XI values you can use: 1 / 2 / 4 / 8 / 16 / 32. on Summit, you might be able to run these benchmark simulations as low as NPROC_XI = 1.
for the model, there is not much difference between using a 1D or 3D model. important parameters affecting the performance would be tiso model or not, full tiso or not, full attenuation or not. the one chosen here was PREM, as it includes tiso. furthermore, the setup time by the mesher is shorter for a 1D model than a 3D model. therefore, the scaling won’t waste too much time for the meshing procedure which is not considered anyway in the scaling plots.
regarding record length, these benchmark simulations all set the DO_BENCHMARK_SIM.. flag in constants.h to true. thus, it will be fixed to 300 time steps. that’s fairly short, but since it also sets the initial wavefield to 1 everywhere (to avoid flushing-to-zero issues), it won’t blow up the simulation and the scaling measurements so far worked pretty well. you would want to plot “average run time per time step” anyway, so having more time steps will just use resources for hardly better results.
note that the reasoning here is to test code scaling. finding an optimal setup for the simulations in INCITE would involve additional parameters and tests.
also, note that for weak scaling, the script will choose different NEX values depending on the size of the simulation. for GLOBE, these simulations will all use a slightly different number of elements per slice (or process) and therefore the “load” will slightly change. for plotting weak scaling, this can be corrected by calculating the “average run time per time step PER ELEMENT”. if you then use a reference simulation with x elements per slice, you can easily plot weak scaling for an x-element simulation. as long as the memory per GPU is not falling below the critical value from above, this “correction“ works well and weak scaling should look almost perfect.
best wishes, daniel
 wjlei1990
 rdno
rdno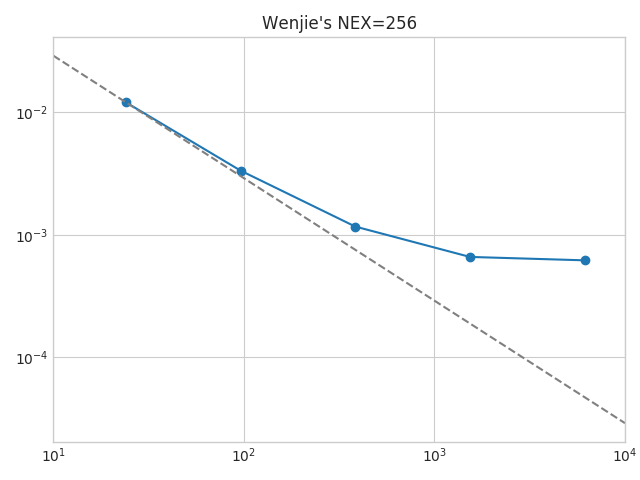
Hi Daniel,
Thanks for putting all these together. I have some questions regarding to the parameters used for benchmark Summit@ORNL.
For the strong scaling how do I pick the parameters for strong scaling, including:
From my previous experience, it is a bit tricky to pick the problem size and GPU numbers. Because using least GPUs may blow out the GPU memory.