/run standalone /run CMSSW
Closed GNiendorf closed 5 months ago
/run standalone /run CMSSW
I did not remember during the meeting that there was no toggle to go to 0.6 from 0.8.
Perhaps we can first test what @VourMa proposed, to check if 0.6 GeV bin files can be used safely (no physics change and no significant slowdown) with the old default 0.8 GeV.
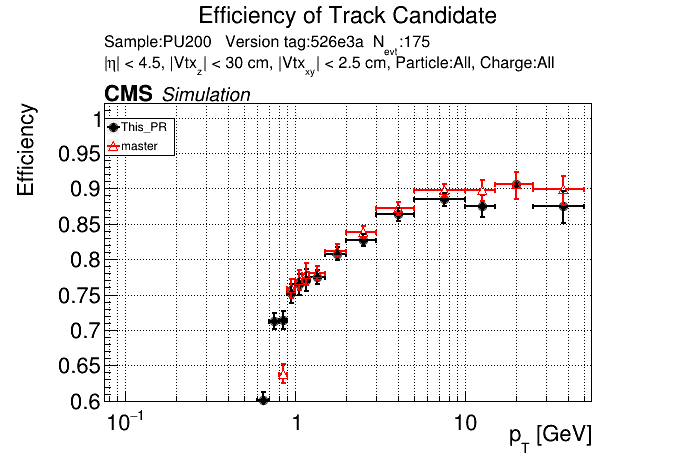
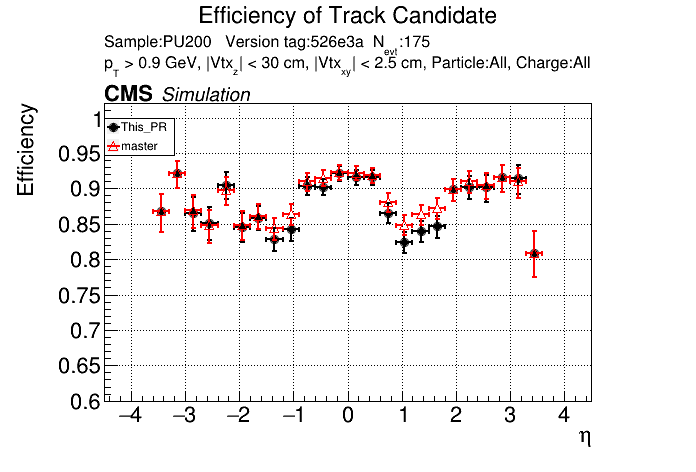
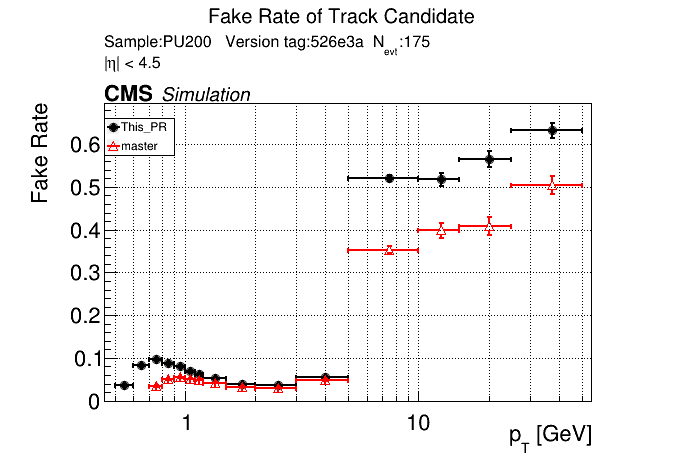
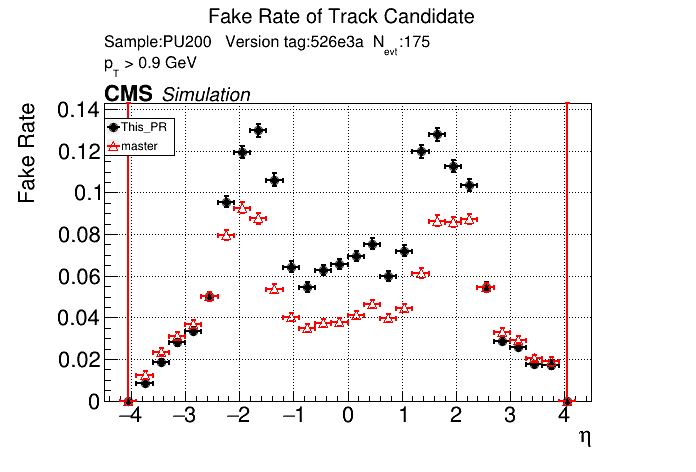
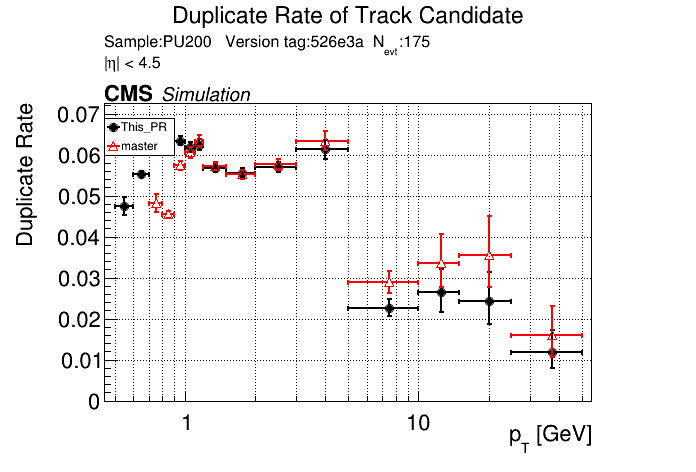
The PR was built and ran successfully in standalone mode. Here are some of the comparison plots.
 |
 |
 |
 |
 |
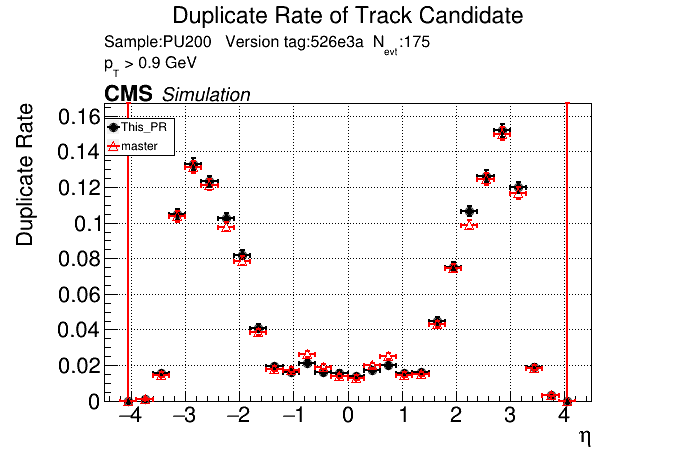 |
The full set of validation and comparison plots can be found here.
Here is a timing comparison:
   Evt    Hits       MD       LS      T3       T5       pLS       pT5      pT3      TC       Reset    Event     Short             Rate
   avg     43.1    324.7    124.0     68.7     93.5    546.3    128.4    156.3    104.3      2.2    1591.5    1002.1+/- 266.5     433.5   explicit_cache[s=4] (master)
   avg     50.6    329.8    373.5    209.2    412.9   1215.4    326.8    747.8    244.0      2.3    3912.3    2646.3+/- 836.5    1020.0   explicit_cache[s=4] (this PR)
Perhaps we can first test what @VourMa proposed, to check if 0.6 GeV bin files can be used safely (no physics change and no significant slowdown) with the old default 0.8 GeV.
Sure, sounds like a good check. I'll make another commit after the CI finishes running and rerun the CI with only the files changed.
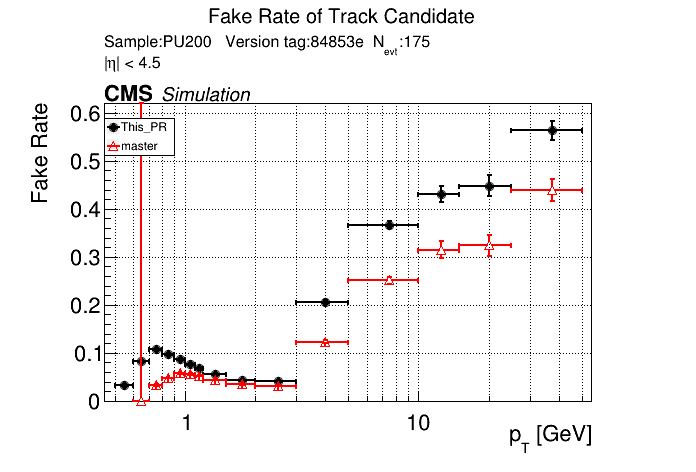
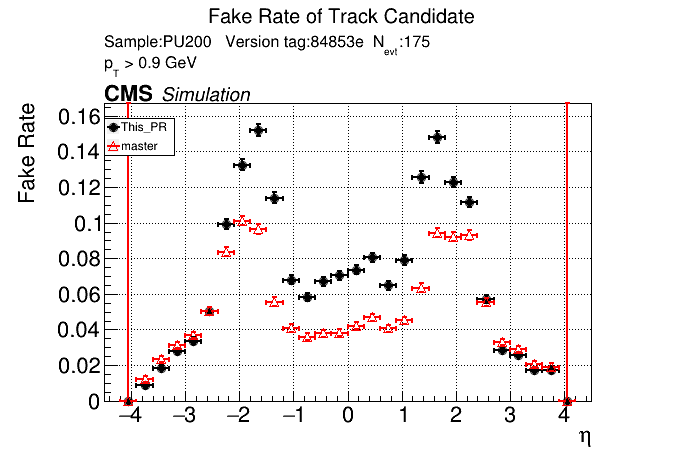
this confirms that fakes are not localized to pt<0.8 GeV. The effect is apparently from the if (pt > 5) passThrough; logic.
I don't think this should block/prevent the low-pt variant to become the default.
But this re-iterates the necessity to review the pass-through selection logic.
Yes, that's what I saw before. pT3's contribute most to the fakerate increase at high pT.
Yes, that's what I saw before. pT3's contribute most to the fakerate increase at high pT.
indeed. the main update since then is that pT is more consistently defined and the step at 5 GeV is now explicit.
Breakdown plot from above, I see what you're saying now @slava77. @ariostas Any chance you could change the CI to also include the breakdown plots for the master branch in the tar file? Right now it just seems like the comparison plots and the breakdown plots for the PR.
There was a problem while building and running with CMSSW. The logs can be found here.
/run standalone /run CMSSW
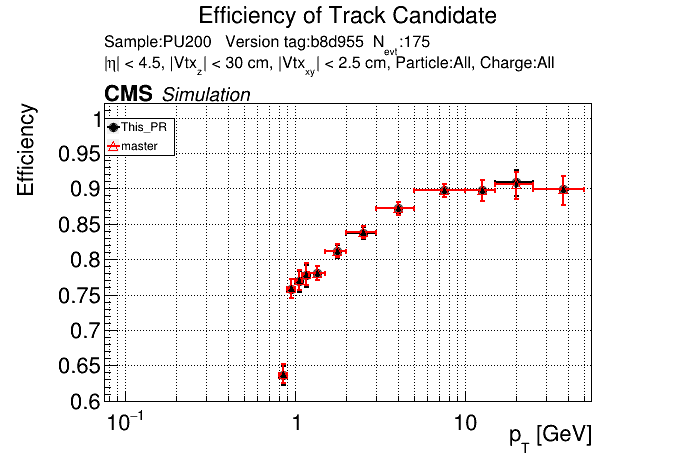
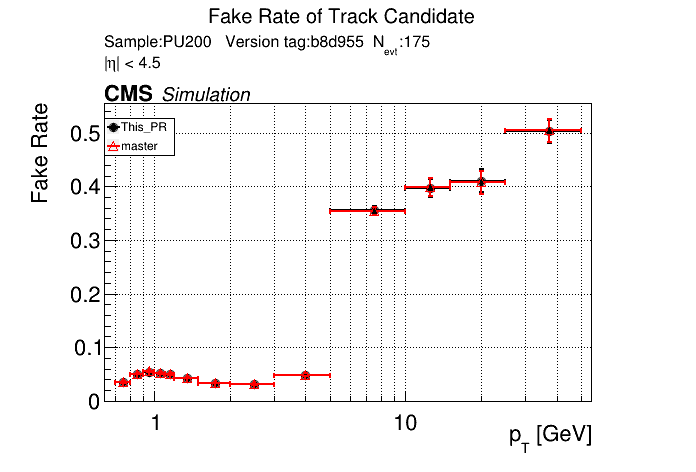
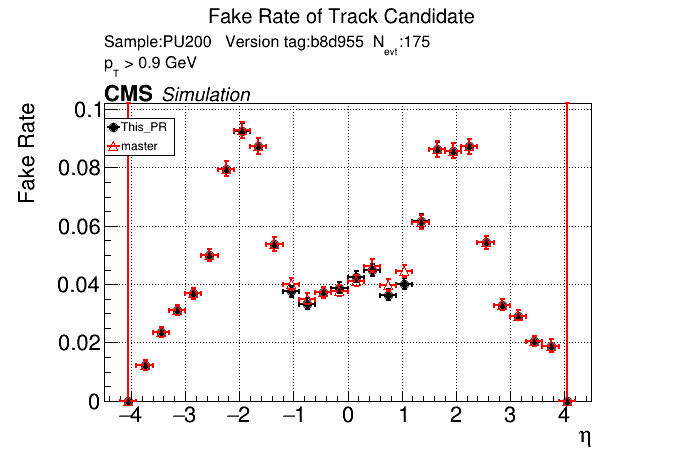
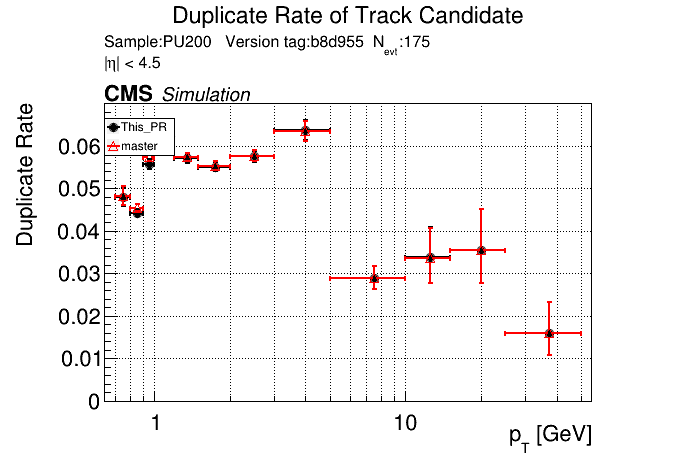
The PR was built and ran successfully in standalone mode. Here are some of the comparison plots.
 |
 |
 |
 |
 |
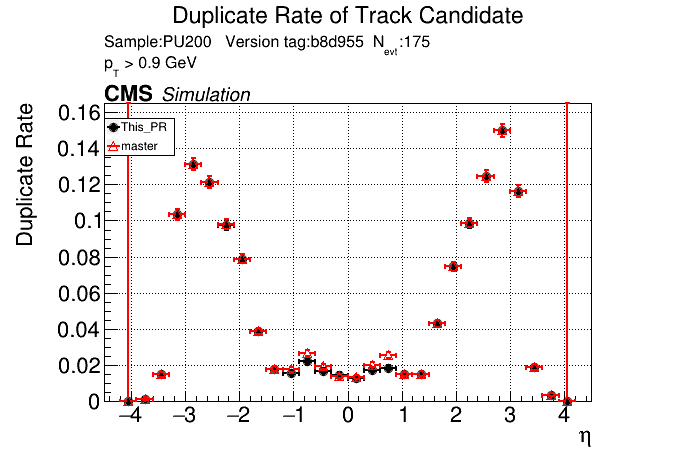 |
The full set of validation and comparison plots can be found here.
Here is a timing comparison:
   Evt    Hits       MD       LS      T3       T5       pLS       pT5      pT3      TC       Reset    Event     Short             Rate
   avg     43.3    322.7    121.8     68.9     93.4    544.2    128.0    158.7    103.6      2.5    1587.1     999.6+/- 266.4     431.1   explicit_cache[s=4] (master)
   avg     43.6    321.5    154.1     69.8     92.6    541.6    122.5    179.0    101.9      1.8    1628.2    1043.1+/- 282.4     441.1   explicit_cache[s=4] (this PR)
There was a problem while building and running with CMSSW. The logs can be found here.
I just updated the CI to use the new version of CMSSW. @GNiendorf I'll restart the cmssw check.
Any chance you could change the CI to also include the breakdown plots for the master branch in the tar file?
I did it this way to keep the size of the archive as small as possible. You could look at the commit history, and check the breakdown plots of the previous PR. But if there's strong reasons to keep both PR and master for each PR I'm happy to implement that.
I did it this way to keep the size of the archive as small as possible. You could look at the commit history, and check the breakdown plots of the previous PR. But if there's strong reasons to keep both PR and master for each PR I'm happy to implement that.
Oh yeah fair point.
The PR was built and ran successfully with CMSSW. Here are some plots.
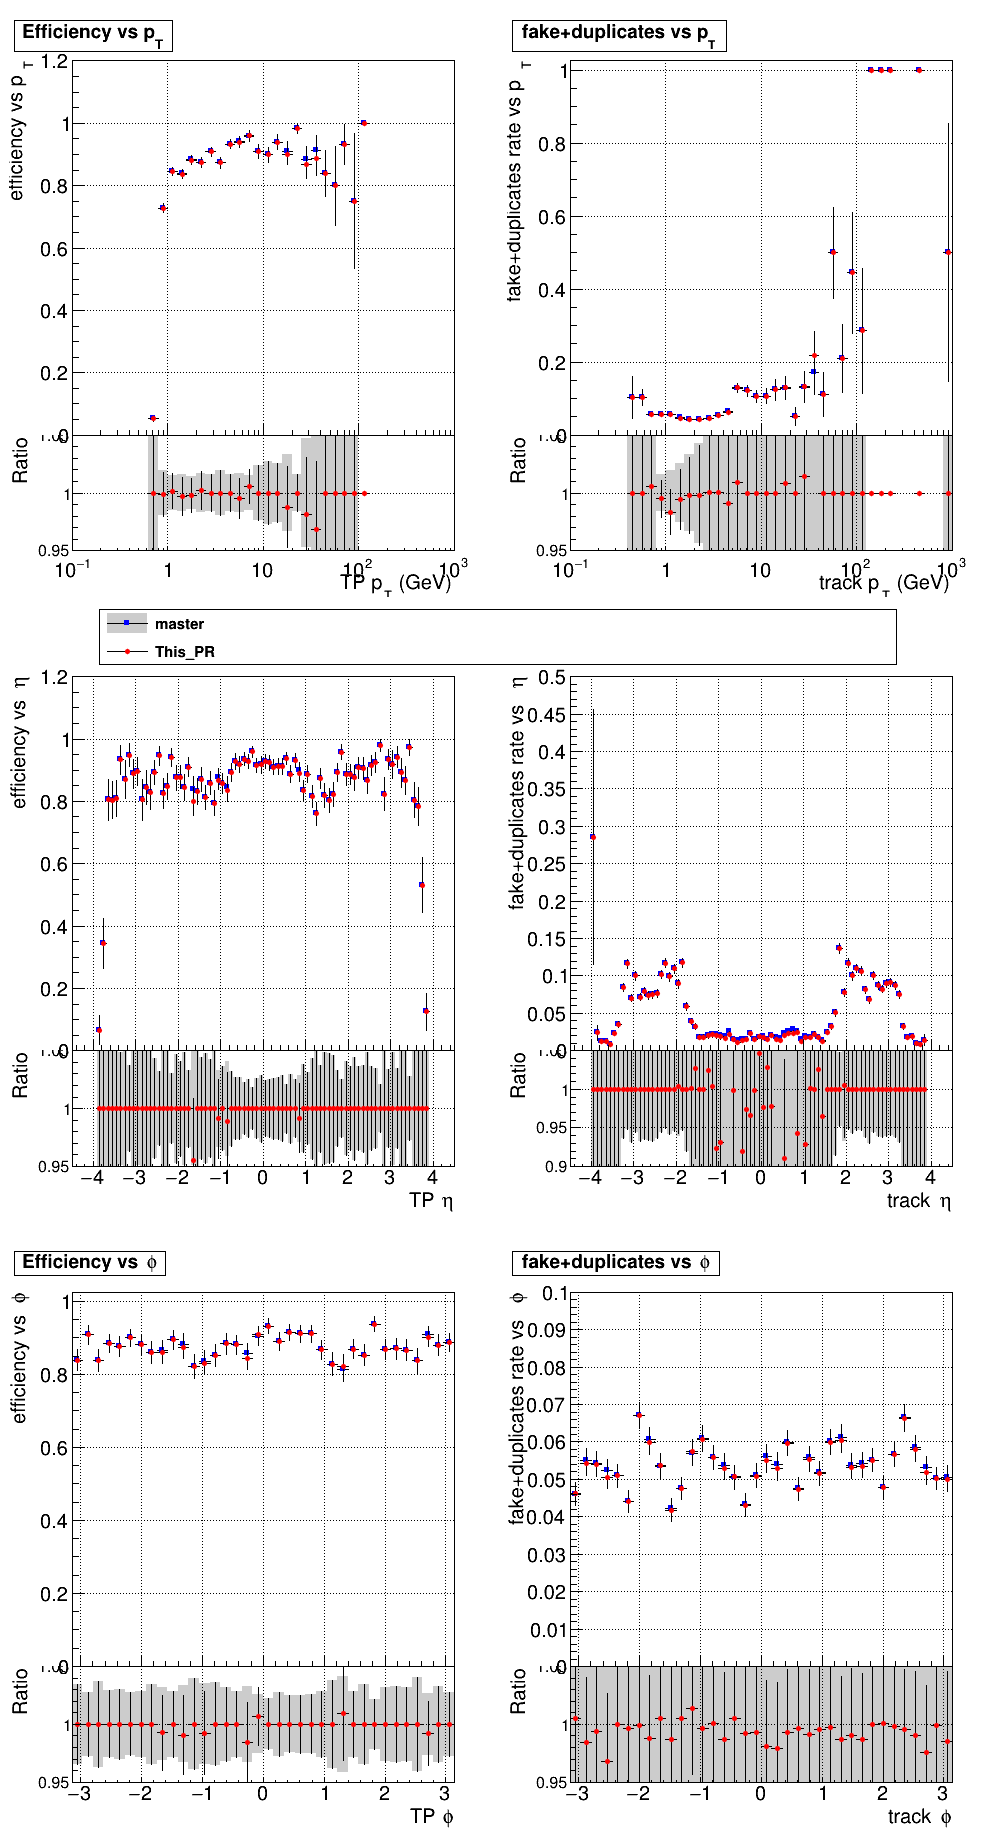 |
The full set of validation and comparison plots can be found here.
@slava77 Timing with 0.6 Maps
Current Master
/run CMSSW
There was a problem while building and running with CMSSW. The logs can be found here.
There was a problem while building and running with CMSSW. The logs can be found here.
From
Module: LSTOutputConverter:highPtTripletStepTrackCandidates (crashed)this may need some manual debugging.
It looks like the 0.6 GeV maps are mostly OK; the CPU variant LS kernel is apparently slower (it's less visible/significant in the GPU case)
@GNiendorf
perhaps you can reproduce this locally.
@ariostas since you know the CI setup, you may get there faster.
after it crashes locally, just run under the GDB.
USER_CXXFLAGS="-g" scram b ... can be used to add the debug symbols
Given that this is an issue within the CMSSW setup probably, maybe @ariostas or @VourMa could take a look?
@GNiendorf yeah, I'll take a look
I opened a PR to fix the issue in https://github.com/SegmentLinking/cmssw/pull/24.
Also, looking at the logs you see that for one of the events you get this warning:
*********************************************************
* Warning: Pixel line segments will be truncated.       *
* You need to increase N_MAX_PIXEL_SEGMENTS_PER_MODULE. *
*********************************************************
So it seems like it's pretty close to the edge and it might be worth increasing that a bit.
I'll run the CI with the above PR to make sure that it works.
/run cmssw 24
The PR was built and ran successfully with CMSSW. Here are some plots.
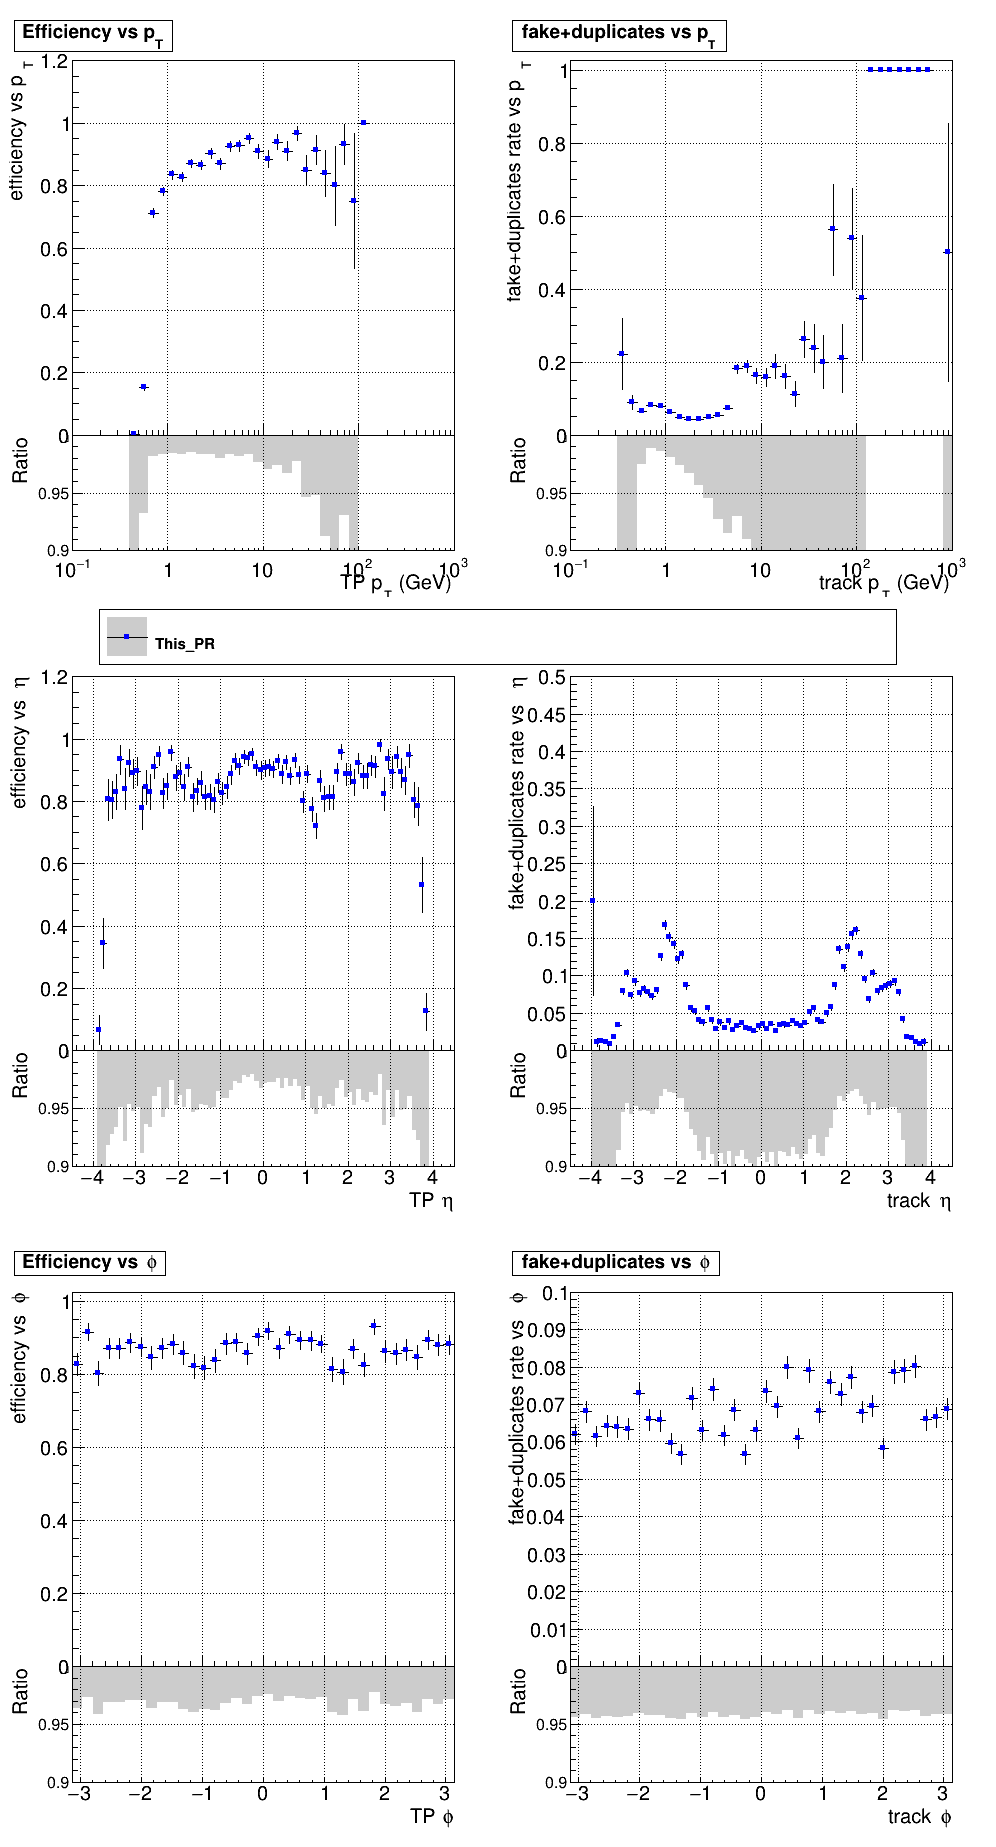 |
The full set of validation and comparison plots can be found here.
The PR was built and ran successfully with CMSSW. Here are some plots.
@ariostas please remind me why the reference is not shown in TrackLooper+cmssw PR test? Can we show the master as is as a reference?
Currently it doesn't do the comparison if using a PR or a different branch, but yeah I should change it so that it does the comparison as long as the cmssw version is the same.
Timing with 0.6 GeV Threshold:
Current Master:
/run standalone
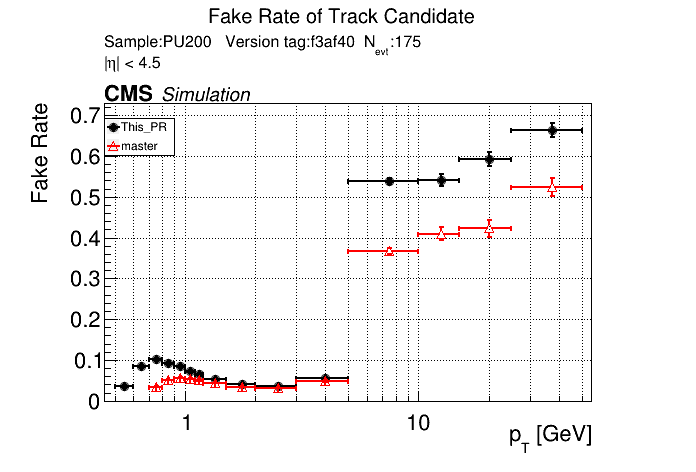
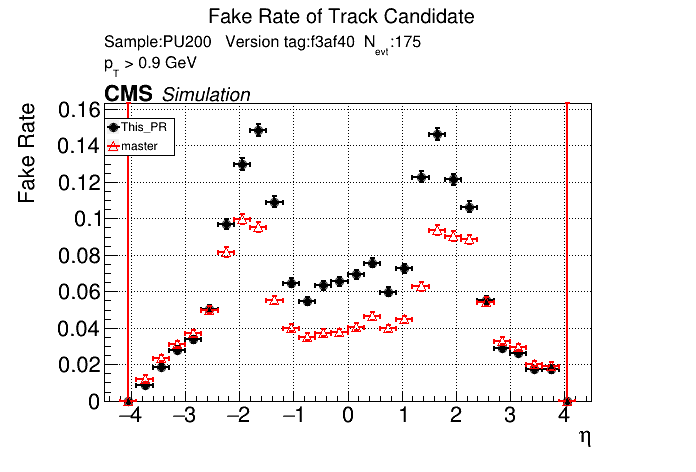
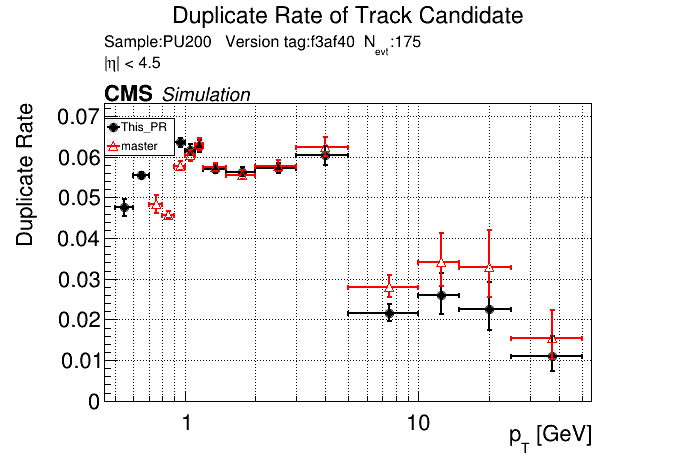
The PR was built and ran successfully in standalone mode. Here are some of the comparison plots.
 |
 |
 |
 |
 |
 |
The full set of validation and comparison plots can be found here.
Here is a timing comparison:
   Evt    Hits       MD       LS      T3       T5       pLS       pT5      pT3      TC       Reset    Event     Short             Rate
   avg     44.4    322.4    120.8     46.7     95.4    543.4    132.2    154.5    106.4      2.1    1568.4     980.6+/- 259.2     427.0   explicit_cache[s=4] (master)
   avg     50.8    327.5    371.7    135.6    434.4   1216.8    339.8    742.2    247.6      2.4    3868.7    2601.1+/- 824.5    1009.8   explicit_cache[s=4] (this PR)
The PR was built and ran successfully in standalone mode. Here are some of the comparison plots.
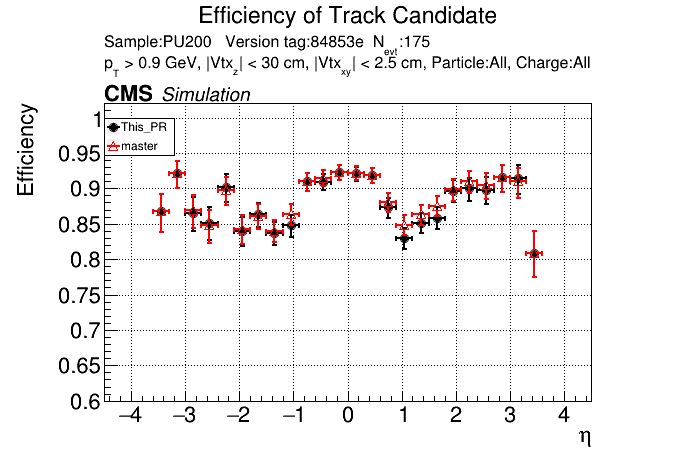
The efficiency loss at high pt worries me.
Does the efficiency in the muon sample look OK?
My more likely guess is that the higher pt tracks in ttbar are in jets and the duplicate cleaning there tends to select fakes instead of good tracks.
@slava77 I changed the code over to the 0.6 maps and the pls threshold to 0.6, and then changed the ptCut variable in the algorithm over for each object, one at a time. Seems like the efficiency starts getting worse when the segments ptCut is moved to 0.6 and slowly gets worse from there. Any suggestions? Ignore the label in the first plot, black is master.
@slava77 Seems like most of the efficiency loss at high pT is because the occupancies are too low. I increased the occupancies and get the following:
Seems like most of the efficiency loss at high pT is because the occupancies are too low.
oh, nice; this is a simpler explanation. Does a warning for overflows come out by default or does it need a debug recompilation?
Seems like most of the efficiency loss at high pT is because the occupancies are too low.
oh, nice; this is a simpler explanation. Does a warning for overflows come out by default or does it need a debug recompilation?
You have to use the -w flag when compiling to get those warnings.
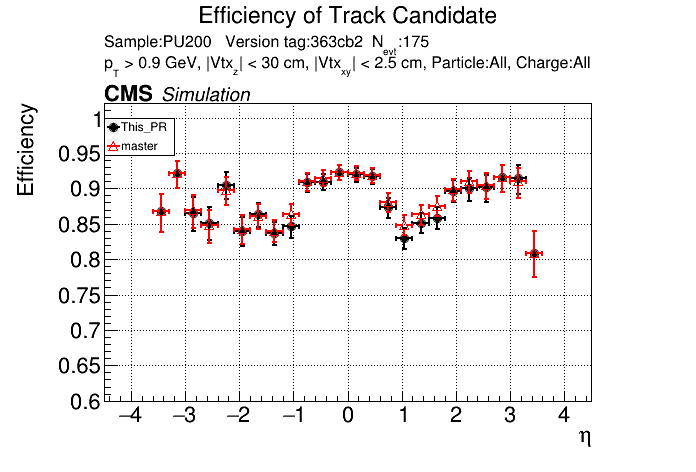
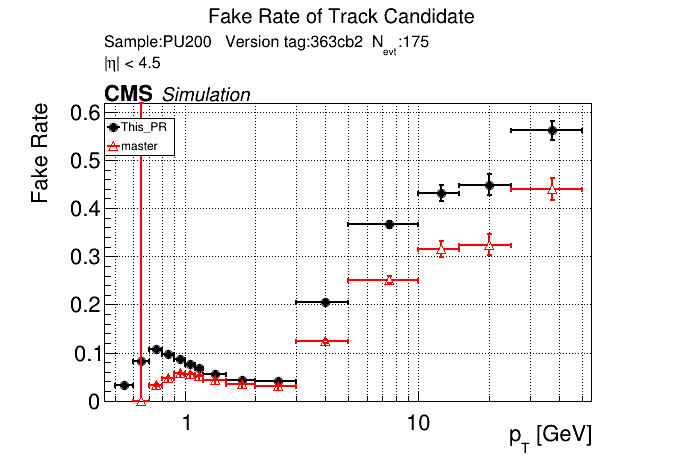
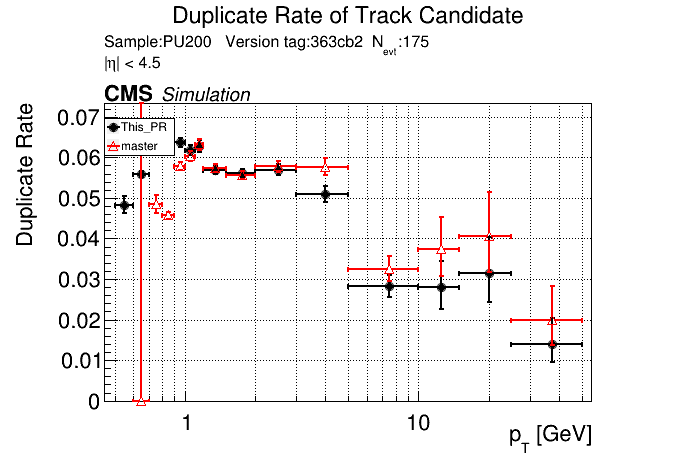
/run standalone /run CMSSW
The PR was built and ran successfully in standalone mode. Here are some of the comparison plots.
 |
 |
 |
 |
 |
 |
The full set of validation and comparison plots can be found here.
Here is a timing comparison:
   Evt    Hits       MD       LS      T3       T5       pLS       pT5      pT3      TC       Reset    Event     Short             Rate
   avg     45.3    326.0    124.2     50.1     97.2    504.6    133.8    159.1    100.7      2.0    1543.0     993.1+/- 259.4     424.7   explicit_cache[s=4] (master)
   avg     55.5    333.0    381.6    178.7    556.3   1134.7    362.0    793.0    236.9      9.0    4040.7    2850.5+/- 972.8    1077.1   explicit_cache[s=4] (this PR)
It seems like the T5 occupancies were set incredibly high. @YonsiG Do you know what percent they were set to? Even at 99.99% I find that the low pT occupancies are lower than the current occupancies.
@GNiendorf is your stat analysis based on non-zero occupancies? or does it increase empty modules?
@GNiendorf is your stat analysis based on non-zero occupancies? or does it increase empty modules?
I changed it to only consider non-zero occupancies.
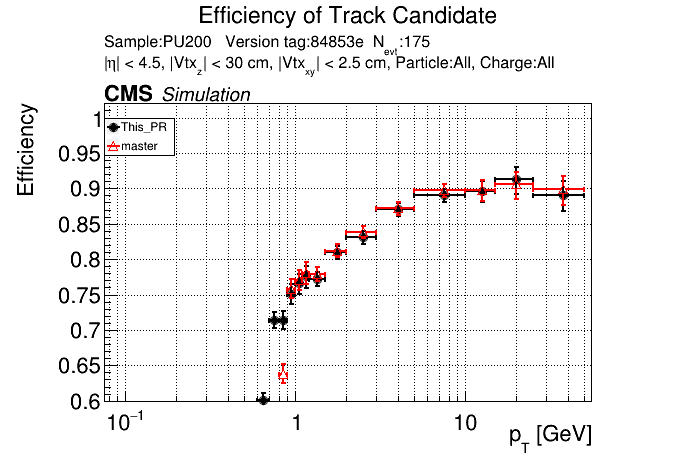
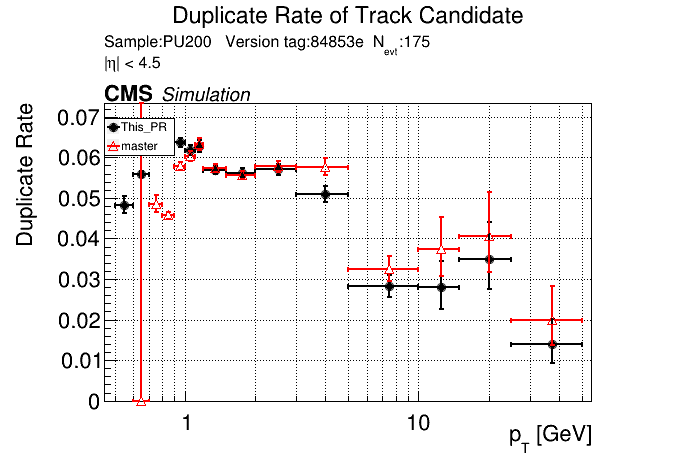
/run standalone /run CMSSW
The PR was built and ran successfully in standalone mode. Here are some of the comparison plots.
 |
 |
 |
 |
 |
 |
The full set of validation and comparison plots can be found here.
Here is a timing comparison:
   Evt    Hits       MD       LS      T3       T5       pLS       pT5      pT3      TC       Reset    Event     Short             Rate
   avg     45.3    322.8    123.9     48.6     96.4    502.0    134.7    157.0     99.6      1.6    1532.0     984.7+/- 262.4     421.4   explicit_cache[s=4] (master)
   avg     57.8    333.7    398.5    185.9    576.2   1232.9    365.1    794.2    251.1     16.2    4211.6    2920.9+/- 985.2    1133.8   explicit_cache[s=4] (this PR)
The PR was built and ran successfully with CMSSW. Here are some plots.
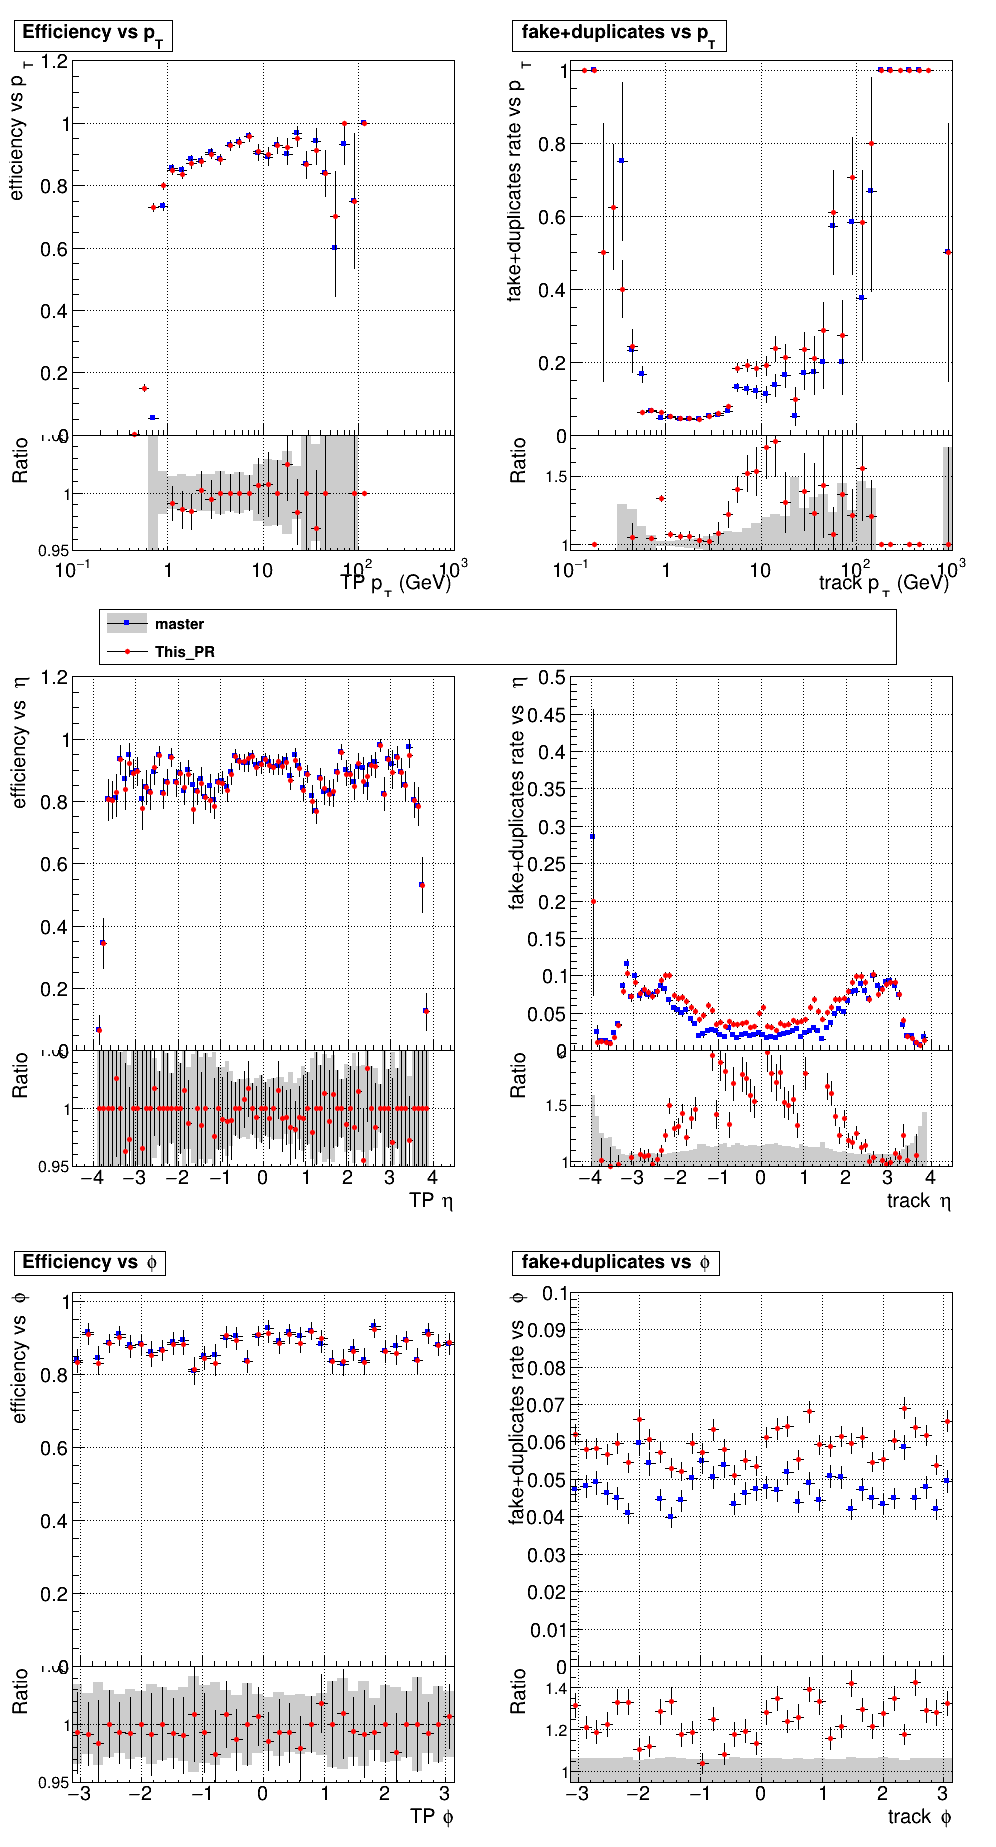 |
The full set of validation and comparison plots can be found here.
Plots for 1000 events: https://www.classe.cornell.edu/~gsn27/www/www/PRlowpT/
Seems like the efficiency difference is pretty minimal now at high pT @slava77
@GNiendorf do you have plots showing how the new occupancy numbers were derived?
@GNiendorf do you have plots showing how the new occupancy numbers were derived?
https://github.com/SegmentLinking/TrackLooper/blob/changept/scripts/compute_occupancies.ipynb
https://github.com/SegmentLinking/TrackLooper/blob/changept/scripts/compute_occupancies.ipynb
file_path = "occ_1000_p06.root"
is this 1K events?
https://github.com/SegmentLinking/TrackLooper/blob/changept/scripts/compute_occupancies.ipynb
file_path = "occ_1000_p06.root"is this 1K events?
Yes, from PU200RelVal
If I increase the occupancies by 10x from where they are in this PR, I get the following:
So it seems like the efficiency at high pT is recovered fully if you put the occupancies high enough.
If I increase the occupancies by 10x from where they are in this PR, I get the following: So it seems like the efficiency at high pT is recovered fully if you put the occupancies high enough.
if the increase goes far above what we have in the master, it could be that what we observe is in part just a recovery of the inefficiency brought in by truncation initially.
How does master compare with just the increase of the occupancy cutoffs (without the change in the pt cut)?
If I just increase the occupancies on master by 10x I get the following.
This PR Timing
Master Timing
Max Memory Usage, Master (L40, 175 events, 8 streams, caching allocator on) 5621MiB / 46068MiB
Max Memory Usage, This PR (same setup) 9419MiB / 46068MiB
Does 46068MiB correspond to the total memory of the card less some restricted value? (specs appear to say the L40 has 48 GB)?
How well is the caching allocator shared between modules of the same process?
What is happening in case of multiple processes? I think that we can expect between 8 and 16 thread jobs populating a 256-core node with at best 2 cards. So, from 8 to as many as 32 (or more?) processes will talk to the same card.
@dan131riley perhaps you know this already, if memory is more restricted that what we usually see in our single job per node tests. What's a good way to test?
PR for discussion of moving the current pT cut from 0.8 to 0.6 GeV.