SiRumCz / CSC501

CSC501 assignments
0 stars 1 forks source link

Visualizations brainstorm #94

Open jonhealy1 opened 4 years ago

jonhealy1 commented 4 years ago

I made this graph in python. You can download the zip file below and open the html to play with the image - it's pretty cool - it rotates and stuff. It's jgraph - it works in javascript too. I think it would be great to use. I haven't figured out how to add node labels but in the javascript example they have on their github they have them. MATCH (s:Subreddit)-[l:LINK]->(t:Subreddit) \ WHERE l.weight < -40 \ RETURN s.id, t.id LIMIT 20

jgraph

https://github.com/patrickfuller/jgraph

make_matrix_fin.html.zip

jonhealy1 commented 4 years ago

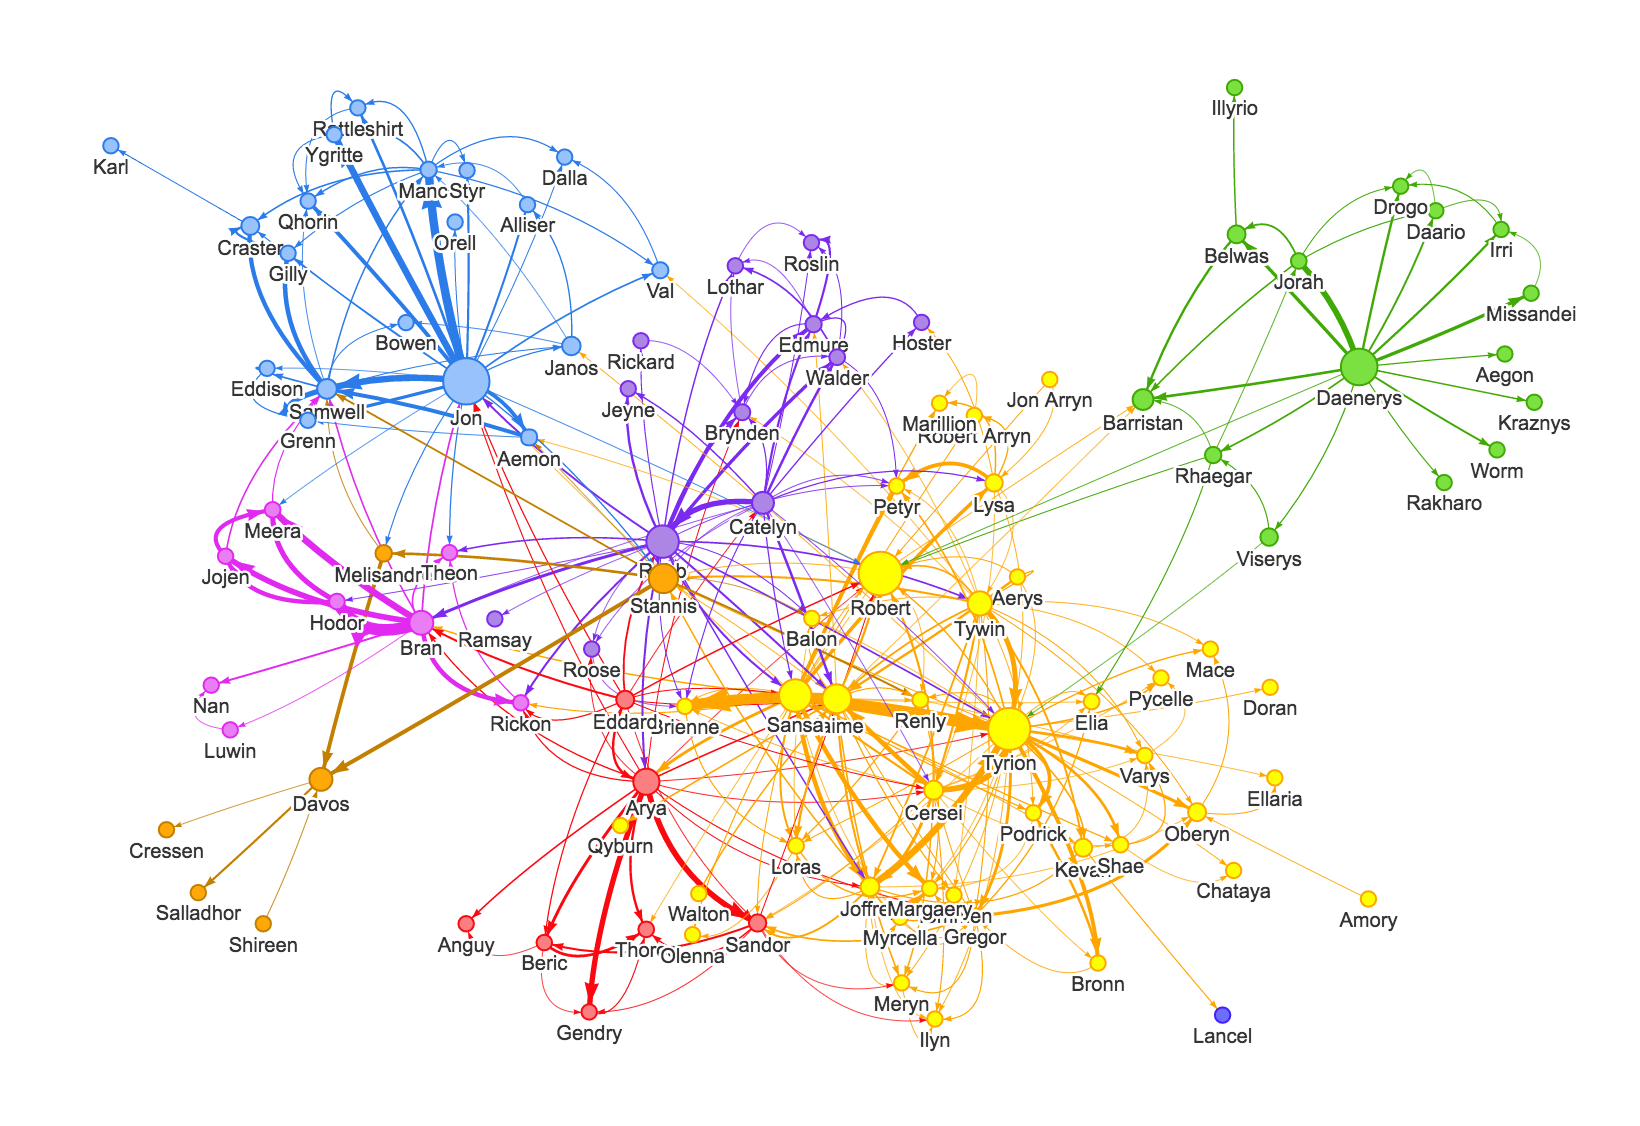
My other thought is neovis. https://github.com/neo4j-contrib/neovis.js I think we can easily implement it. It can run alongside d3.js. The example they use contains very little code. There are alternate instructions here: https://www.lyonwj.com/2016/06/26/graph-of-thrones-neo4j-social-network-analysis/
Screen Shot 2019-11-06 at 10 00 02 AM

SiRumCz commented 4 years ago

I saw this second graph on their github page, I think it is identical to a directional weighted node link diagram. I talked to him, I think right now the urgent feature for visualization is 1) the order by (cluster, name, frequency) in adjacency matrix, and 2) shortest path diagram, or something similar like what you are showing above.

jonhealy1 commented 4 years ago

The cool thing about the neovis diagram - the second one - is that is that it clusters nodes in communities and uses page rank as well. It also shows weights for the link size between nodes.

SiRumCz commented 4 years ago

I just checked the first one you uploaded, it is a cool 3d viz(its like getting into body cells), I wonder how we could draw insights from it.

jonhealy1 commented 4 years ago

With labels it would be good. This is the same graph in 2D. It's just alot easier to examine the connections when it's in 3d and you can move it around I think. The insights are just the negative interactions between different groups. It's interesting. Screen Shot 2019-11-06 at 12 38 48 PM

jonhealy1 commented 4 years ago

Like if you take out the LIMIT 20 it can be too busy in 2D but 3D is better I think.

SiRumCz commented 4 years ago

With labels it would be good. This is the same graph in 2D. It's just alot easier to examine the connections when it's in 3d and you can move it around I think. The insights are just the negative interactions between different groups. It's interesting. Screen Shot 2019-11-06 at 12 38 48 PM

nice, what does color mean?

jonhealy1 commented 4 years ago

the color is the community Screen Shot 2019-11-06 at 12 45 38 PM

jonhealy1 commented 4 years ago

This is part of the graph with the LIMIT taken out. Subredditdrama is the center of all drama haha.

Screen Shot 2019-11-06 at 12 47 44 PM

jonhealy1 commented 4 years ago

This is better now: the size of the nodes is pagerank Screen Shot 2019-11-06 at 12 50 42 PM

jonhealy1 commented 4 years ago

Screen Shot 2019-11-06 at 12 56 56 PM

soroushysfi commented 4 years ago

Mine is not showing anything, just a blank box. Do you know what the problem would be? this is the html file in the visualization folder right?

jonhealy1 commented 4 years ago

Mine is not showing anything, just a blank box. Do you know what the problem would be? this is the html file in the visualization folder right?

The html file in the visualizations folder only runs after you run neo4j with the database that is on my new branch from the database folder

jonhealy1 commented 4 years ago

It should show this even with the regular neo4j database: Screen Shot 2019-11-06 at 6 48 16 PM

soroushysfi commented 4 years ago

Mine is not showing anything, just a blank box. Do you know what the problem would be? this is the html file in the visualization folder right?

The html file in the visualizations folder only runs after you run neo4j with the database that is on my new branch from the database folder

Yeah I checked before I load the html. I was sure that I have the database running. But still not seeing anything.

jonhealy1 commented 4 years ago

Did you use the password in neo4j browser. I can't understand why it wouldn't work. Could you please put this on our web page?

soroushysfi commented 4 years ago

Did you use the password in neo4j browser. I can't understand why it wouldn't work. Could you please put this on our web page?

I don't know why it's not working. My data base is working with other parts of the project and I'm not getting any console error. I think Kevin merged it and put it in our project so we're good to go.

jonhealy1 commented 4 years ago

The neo4j folder that is in the databases folder needs to be unzipped and moved to the assignment 3 folder. I bet $100 you don't have a database with the data active. I was hoping it could be put in our react app as react is the front page of everything in our assignment.