Closed camlin closed 1 year ago
RESTHeart does not cache query results. It does have a mechanism to speed up requests for your use case, called Cursor Pool, see https://restheart.org/docs/mongodb-rest/speedup-requests-with-cursor-pools
Getting the n-th page implies using cursor.skip((n-1)*pagesize)
. The fact that subsequent pages take longer and longer depends on the MongoDB cursor.skip()
operation that slows downs linearly. See https://www.mongodb.com/docs/manual/reference/method/cursor.skip/
The skip() method requires the server to scan from the beginning of the input results set before beginning to return results. As the offset increases, skip() will become slower.
In the same doc page, MongoDB suggests to use Range Queries, that is exactly what you already want to do and the correct way of querying a collection with 5 millions documents.
Consider using range-based pagination for these kinds of tasks. That is, query for a range of objects, using logic within the application to determine the pagination rather than the database itself. This approach features better index utilization, if you do not need to easily jump to a specific page.
The Cursor Pool features tries to speed up queries by pre-allocating cursors where the skip
operation is executed for the subsequent pages. However it won't help if the requests are executed quickly one after the other or in parallel, because it does require some time to actually allocating the cursors. For instance, it work very well in the common case of an application showing paginated data to a user, who changes page with some delay.
You might also want to define an aggregation; in this case you can optimize your query and also pass the time boundaries via variables
Ok, thanks. This is very useful. Reading your post I initially thought "ok, but linear is the default mode, so why is it not finding a cursor near to the end of my previous page" until you said:
However it won't help if the requests are executed quickly one after the other or in parallel, because it does require some time to actually allocating the cursors. For instance, it work very well in the common case of an application showing paginated data to a user, who changes page with some delay.
That explained the very problem I was seeing (as, in my case, I am programmatically getting several pages).
And looks like what I was thinking I could use as a hack is in fact what they call "range queries" 😂
Anyway, I still do wonder if the cursor pooling could not be improved. Basically, when a page is returned, it could leave the current cursor open (which will then be pointing to the next page) and just add it to the cursor pool, no?
I think you are right. I'll give it a look and see if it can be improved this way.
Thanks
As common with caches, I initially thought this would be a super easy improvement, but it was not.
I ended up rewriting completely the caching logic of RESTHeart, removing the cursor pre-allocation engine (that is not always useful and can also put too much pressure on MongoDB in case of complex filters).
Now the caching logic is pretty simple but more effective.
If a request specifies the ?cache
query parameter, than it uses the cache.
The get collection cache is configured as follows:
mongo:
uri: /
# get collection cache speedups GET /coll?cache requests
get-collection-cache-size: 100
get-collection-cache-ttl: 10_000 # Time To Live, default 10 seconds
get-collection-cache-docs: 1000 # number of documents to cache for each request
On the first GET /coll?cache&page=5&pagesize=100
request, up to get-collection-cache-docs
will be cached from the db.
A subsequent GET /coll?cache&page=6&pagesize=100
request will use the cached documents.
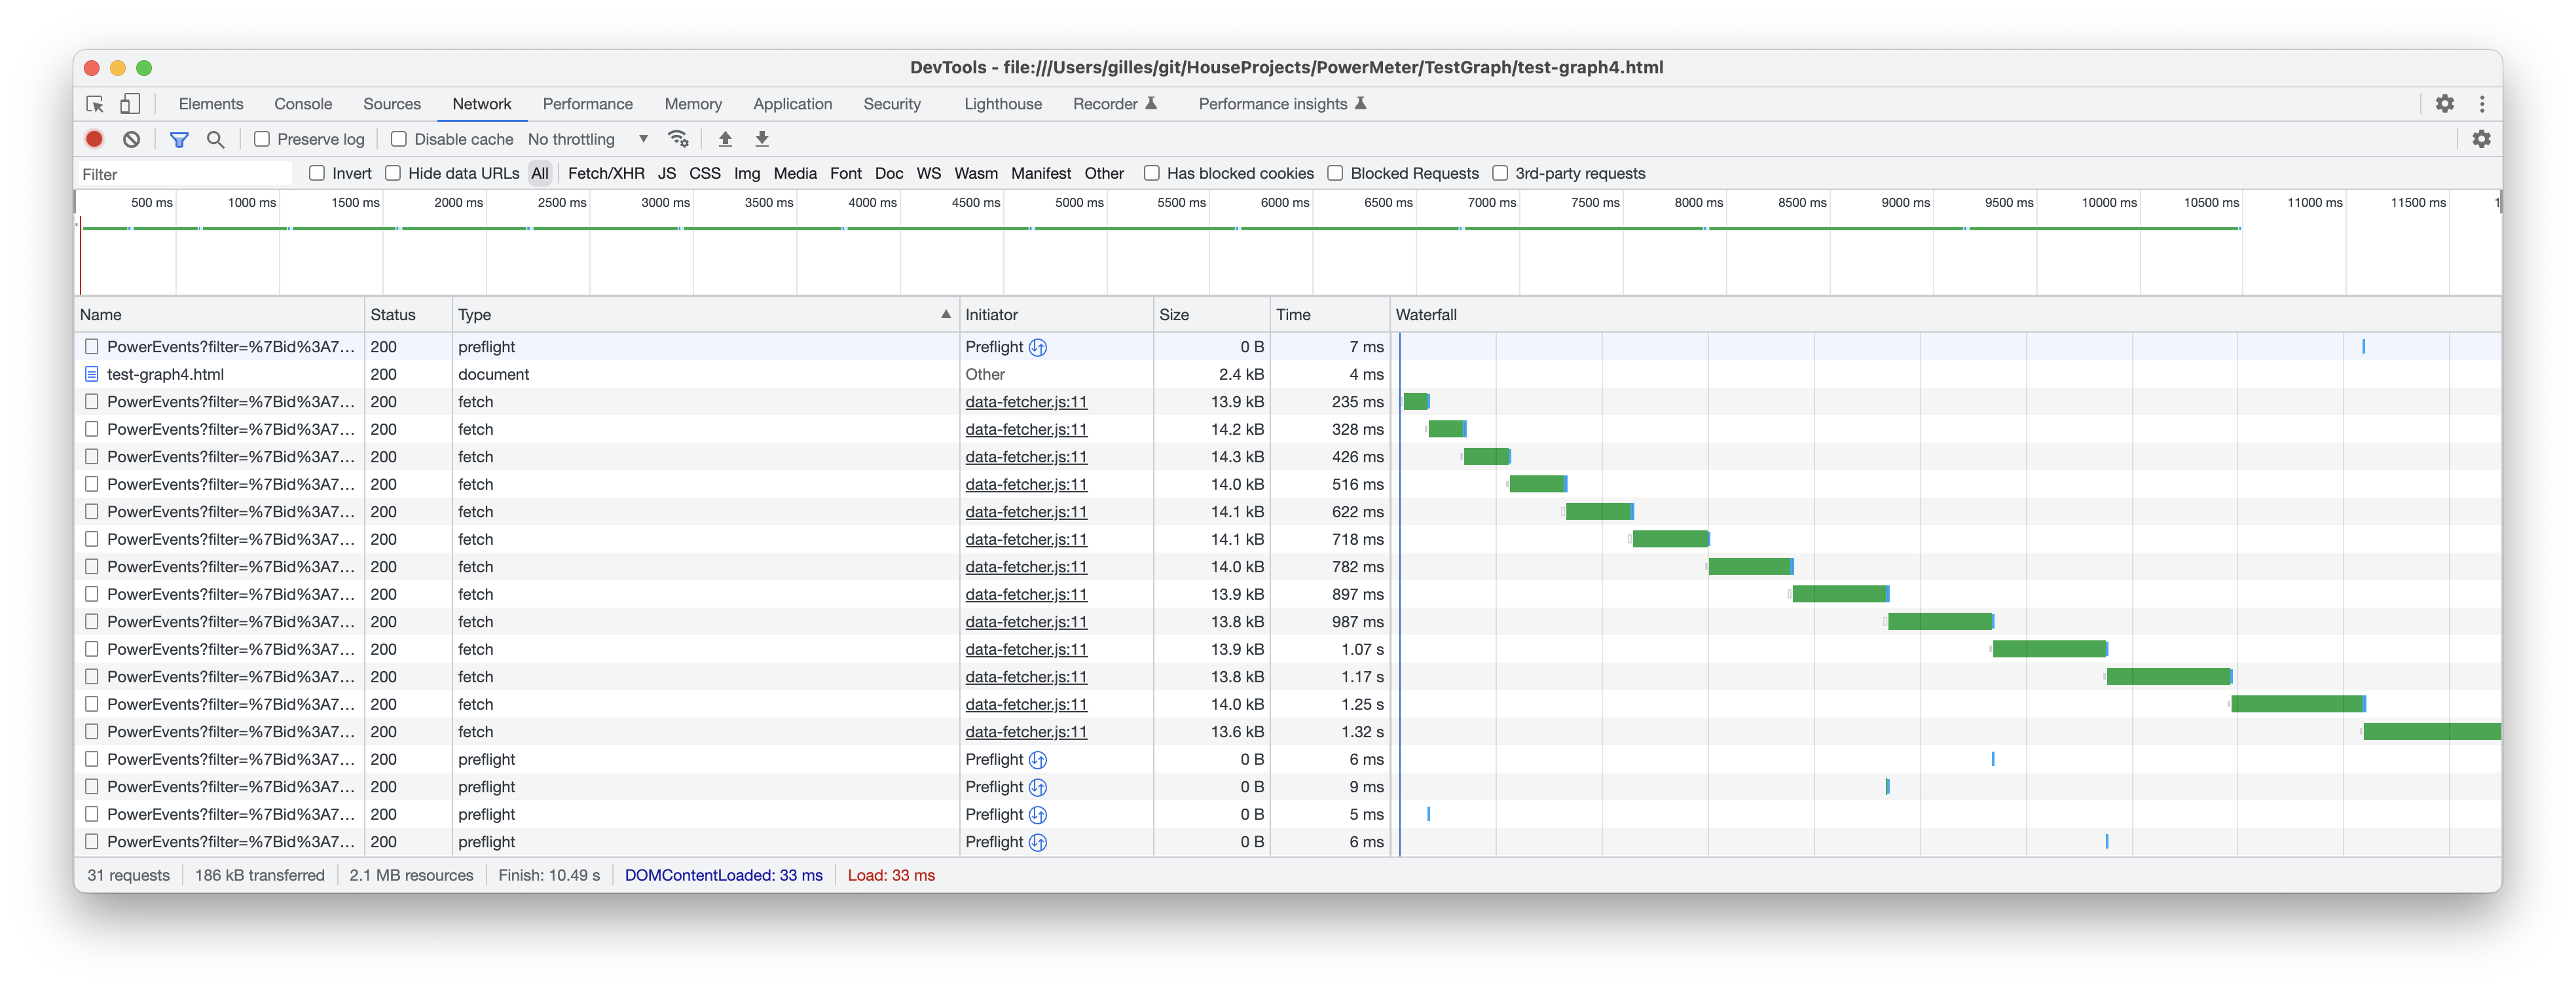
The following screenshot shows 100 NOT cached requests to a big collection taking about 9 secs to complete.
The following shows the same 100 requests specifying the query parameter ?cache
taking about 3,5 secs.
Of course, using ?cache
can lead to retrieve obsolete data, so it is responsibility of the client using it correctly.
Hello @camlin,
it would be super useful if you could try this in your use case.
For this, you can use the snapshot docker image:
$ docker run -it --rm -p "8080:8080" softinstigate/restheart-snapshot:794cad0
The command assumes that MongoDB is running locally. If you want to override the mongo-uri
parameter, with v7 you can set the RHO env variable:
$ docker run -it --rm -p "8080:8080" -e RHO="/mongo-uri->'mongodb://your-mongo-uri'" softinstigate/restheart-snapshot:794cad0
Thanks 👍 I will definitively try.
It is quite possible I will only be able to try this over the weekend but TBD. I will follow-up in any case.
Just FYI, I am now in the process of testing your fix.
However, in the meantime (before you posted your fix), I had switched to the other solution which was to always request for one page (i.e. page=1 on every query) but then artificially change the query to make the "time" argument start from the last value in the data just received.
This was probably still not quite ideal as each query was pointing/representing a large data set (at the MongoDB level). That dataset being pointed at would reduce over each query. But at least, each time I was getting the first page (and only the first page) that started directly at the new "time" index (for each query).
Applying this "hack" meant that I was now getting this response graph (where we can see that each query has now a more or less constant response time):
Now, ideally, if the page mechanism works correctly (and the REST query manages to reuse the open query and its associated cursor) then I would expect (ideally) something along the lines of:
But we will see, it will be interesting in any case 😁 (note: to test your update I will go back to my original code that queried page 1 to n).
My Collection has continued to grow in the meantime (now 6.5 millions of documents) so to have a reasonable reference point I re-ran the test with my original code (that retrieves each pages one after the other) and the response graph was as follow (so not too different from the original one):
Now switching to your updated code...
Ok, getting there. I will probably still need your help but the results are already very interesting and promising.
First, to test this I had to change my setup a bit. Normally the MongoDB and RestHeart runs on a small dedicated micro-computer (my domotics server 😉) which does not run docker.
So instead I ran your docker on my main computer and made it use the remote MongoDB.
Your suggested docker command (with the RHO param) came in very handy and with the help of #420 and #425 I was able to get it to run, i.e. the command I used became:
docker run -it --rm -p "8080:8080" -e RHO="/mongo-uri->'mongodb://192.168.2.11:27017/';/http-host->'0.0.0.0';/mongo-mounts[1]->{'where': '/', 'what': '/IoT-Logs'}" softinstigate/restheart-snapshot:794cad0
And I re-ran my test again, using that new instance of RestHeart and without the cache
param, which gave me my starting base point:
Which is not too different from my previous tests (just a bit slower, which is to be expected as RestHeart and MongoDB were now on different machines).
I then added the cache argument, meaning the query became something like this:
http://192.168.2.120:8080/PowerEvents?cache&filter={id:709,time:{$gt:1669376889218,$lt:1669463289218}}&sort={time: 1}&pagesize=1000&page=13
And to be honest, I saw no change:
Now I suspect that was because my pages were exceeding the caches parameters. So I tried again but this time asking for pages of 100 documents (instead of a 1000) and I got some very interesting results:
In that graph we can clearly see that the cache was providing very notable improvements (when cached page hit) but because I am pulling back a lot of data we can see it regularly has to re-run the query again (and each time it does, it takes longer, hence highlighting it was re-running the whole query and having to skip/seek results).
In my case, what I basically want to do is get the daily data of a sensor and do some complex calculations on it (outside of what MongoDB aggregation can do). Different sensor types have different data rate but I know that the data for a day would be less than 20,000 documents.
So I am thinking that, all I need to do, to get perfect caching, is to change the get-collection-cache-docs
config parameter to be 20,000.
The one I am not sure about was get-collection-cache-size
. From the comments, it is not clear to me what it is for. Is it the maximum number of queries that would be cached? If so, I suspect I could leave it "as-is". Now, I wondered if it could be related to the page size so, just in case, I tried to set it to 10000
.
In order to apply these changes I tried the following command:
docker run -it --rm -p "8080:8080" -e RHO="/mongo-uri->'mongodb://192.168.2.11:27017/';/http-host->'0.0.0.0';/mongo-mounts[1]->{'where': '/', 'what': '/IoT-Logs'};/get-collection-cache-size->'1000';/get-collection-cache-docs->'20000'" softinstigate/restheart-snapshot:794cad0
But it had no effect (same response times).
Now I suspect that's because my command is wrong. In your extract I saw they were children of mongo->uri but I saw no such structure in my current config (except for plug-ins).
So, @ujibang , could you confirm how I could tweak these values from the docker command line?
Thanks
I also tried the following command:
docker run -it --rm -p "8080:8080" -e RHO="/mongo-uri->'mongodb://192.168.2.11:27017/';/http-host->'0.0.0.0';/mongo-mounts[1]->{'where': '/', 'what': '/IoT-Logs'};/mongo->{'uri': '/', 'get-collection-cache-docs': '20000'}" softinstigate/restheart-snapshot:794cad0
but I am not convinced it changes the config param either although it does report this on start up:
12:31:15.630 [main] INFO org.restheart.Configuration - Overriding configuration parameters from RHO environment variable:
12:31:15.630 [main] INFO org.restheart.Configuration - /mongo-uri -> mongodb://192.168.2.11:27017/
12:31:15.630 [main] INFO org.restheart.Configuration - /http-host -> 0.0.0.0
12:31:15.630 [main] INFO org.restheart.Configuration - /mongo-mounts[1] -> Document{{where=/, what=/IoT-Logs}}
12:31:15.630 [main] INFO org.restheart.Configuration - /mongo -> Document{{uri=/, get-collection-cache-docs=20000}}
We are quite close to release v7 that comes with a new configuration file format.
I'm sending you the docker command with the correct RHO for the new format (for instance, mongo-uri
is now /mclient/connection-string
)
$ docker run -it --rm -p "8080:8080" -e RHO="/mclient/connection-string->'mongodb://192.168.2.11:27017/';/http-listener/host->'0.0.0.0';/mongo/mongo-mounts[1]->{'where': '/', 'what': '/IoT-Logs'};/mongo/get-collection-cache-docs->20000" softinstigate/restheart-snapshot:b5fbf4d
ps
you can use the -c
argument, to print the effective configuration (default configuration + RHO overrides) to check your parameters
$ docker run -it --rm -p "8080:8080" -e RHO="/mclient/connection-string->'mongodb://192.168.2.11:27017/';/http-listener/host->'0.0.0.0';/mongo/mongo-mounts[1]->{'where': '/', 'what': '/IoT-Logs'};/mongo/get-collection-cache-docs->20000" softinstigate/restheart-snapshot:b5fbf4d -c
.......
http-listener: {enabled: true, host: 0.0.0.0, port: 8080} <========
......
mclient: {connection-string: 'mongodb://192.168.2.11:27017/'}
mongo:
enabled: true
uri: /
mongo-mounts:
- {where: /, what: /IoT-Logs} <========
default-representation-format: STANDARD
etag-check-policy: {db: REQUIRED_FOR_DELETE, coll: REQUIRED_FOR_DELETE, doc: OPTIONAL}
get-collection-cache-size: 100
get-collection-cache-ttl: 10000
get-collection-cache-docs: 20000 <========
....
Thanks for your help @ujibang , the latest results are quite impressive. I re-ran the test using the command you sent me combined to using again pages made of 1000 documents max and I basically got this:
In that graph, you can clearly see the cache is working quite well. In fact it meant I got the data in about 3.18s which is even faster than the hack I used where I request always page "1" and just update the parameters on each request to get the index to move instead. That hack had a response time of around 3.5s... (which is logical as it still had to check the indexes, which would be slower than just getting the next cached page).
What is also interesting in the graph is that the very last request is quite slow again (about the same time as the first request). That last request contains 900 documents (of a 1000 max the page could have contained) as we reach the end of the data set.
I wonder if that's because your mechanism/cache went back to MongoDB to re-run the query to check if there was further data?
I kind of feel that could be unnecessary as you can't know if some of the new data could have needed to appear in some of the intermediate pages (as this is an ordered query).
Now, there are probably other reasons that I don't know about that are causing this.
But, if you were able to optimise that last query (and perhaps make it avoid the unnecessary full query being sent back again to MongoDB) then my code would have been able to retrieve the whole data in about 1.6s or so.
And that would have pulverised the hack / Ranged Queries solution 😁 (at the moment, in my scenario, they are more or less equal to RestHeart caching mechanism).
Still, excellent work: It means devs trying to use the page mechanism will get a very reasonable level of performance without having to revert to rather dubious solutions.
And thanks for your help 👍, I am looking forward to v7 😁
I updated the documentation about caching https://restheart.org/docs/mongodb-rest/caching
ps yesterday we published v7 https://github.com/SoftInstigate/restheart/releases/tag/7.0.0
Regarding your last query not using the cache, consider the following case:
The collection coll
holds 10.051 documents.
The requests:
GET /coll?page=10&pagesize=1000
returns 51 documents (from 10.000 to 10.051) and the cache holds the entry E
with the same 51 documents.
A request for page 11 should return an empty result array []
`GET /coll?page=11&pagesize=1000
This is not using the cache, since there are no entries with the possible documents to return, i.e. documents from 1.100 to 1.200. Remember that the cache has an entry with documents from 10.000 to 10.051.
This means that all requests to a page > 10 will never use the cache.
I can improve this by adding a new cache entry condition: in fact the entry E
is obviously of 51 documents < get-collection-cache-docs
because it reached the last page. In this case I can just return an empty result for pages > 10.
I updated the documentation about caching https://restheart.org/docs/mongodb-rest/caching ps yesterday we published v7 https://github.com/SoftInstigate/restheart/releases/tag/7.0.0
Neat 👍
Regarding your last query not using the cache, consider the following case:
The collection
coll
holds 10.051 documents.The requests:
GET /coll?page=10&pagesize=1000
returns 51 documents (from 10.000 to 10.051) and the cache holds the entry
E
with the same 51 documents.A request for page 11 should return an empty result array
[]
`GET /coll?page=11&pagesize=1000
This is not using the cache, since there are no entries with the possible documents to return, i.e. documents from 1.100 to 1.200. Remember that the cache has an entry with documents from 10.000 to 10.051.
This means that all requests to a page > 10 will never use the cache.
I can improve this by adding a new cache entry condition: in fact the entry
E
is obviously of 51 documents <get-collection-cache-docs
because it reached the last page. In this case I can just return an empty result for pages > 10.
To use your example, and from memory, I expect my code to have stopped the request at page 10 and it would not have tried to request page 11. The reason is that I stop requesting pages as soon as I get less results than the requested pagesize
.
So I think, by your logic (and if I got it right), it should have been quick on page 10... But ok, it means I likely have made some mistake somewhere in my code, so I will double check and come back to you.
Thanks.
Hi @camlin,
I fixed the issue with the caching not working for page >= last available page
As usual you can try the snapshot release:
$ docker run -it --rm -p "8080:8080" -e RHO="/mclient/connection-string->'mongodb://192.168.2.11:27017/';/http-listener/host->'0.0.0.0';/mongo/mongo-mounts[1]->{'where': '/', 'what': '/IoT-Logs'};/mongo/get-collection-cache-docs->20000" softinstigate/restheart-snapshot:5e639a9
Hi @ujibang
I tried the snapshot and it worked! 😁
The caching mechanism is now officially crushing the old hack 👍
I think we can now consider that problem fixed. I won't close the ticket as I suspect you will do so when that fix is officially released but I will be eagerly waiting for the next release of that build.
Thanks again for your help.
Camlin
Note: I had errors (Factory is not set on the JXPathContext - cannot create path: /.[@name='mongo-mounts']
) when running the command you suggested, so I went to the command I previously used and I just changed the tag number on it to make it point to your new snapshot and that worked fine. I suspect you are still mid-way changing some config param stuff 😉
7.1 is out and fixes this issue.
Doing a GET request to retrieve multiple pages of documents takes longer and longer for each subsequent page.
Expected Behavior
I would have expected RestHeart/MongoDB to cache the query meaning the initial Get (page 1) would have taken most of the time and getting the subsequent pages would have taken noticeably less time.
Current Behavior
Each time I increment the page (without changing the query) the request takes longer and longer to return the result:
Context
First request is this query and takes 300ms: http://192.168.2.11:8080/PowerEvents?filter=%7Bid%3A492%2Ctime%3A%7B%24gt%3A1668099145480%2C%24lt%3A1668185545480%7D%7D&sort=%7Btime%3A+1%7D&pagesize=1000&page=1
i.e.:
The last request is this query and takes 1280ms: http://192.168.2.11:8080/PowerEvents?filter=%7Bid%3A492%2Ctime%3A%7B%24gt%3A1668099145480%2C%24lt%3A1668185545480%7D%7D&sort=%7Btime%3A+1%7D&pagesize=1000&page=13
i.e.:
The collection is indexed by the "time" value.
The "id" is just a device identifier and is different from the MongoDB "_id" (which are unique).
I suspect I will hack it by always requesting "page=1" and just programmatically increment the time filter so that it matches the "next page" boundary (thus relying on the MongoDB index), but that should not have been necessary.
Also note that the browser correctly keeps the connection alive and re-use it to request the subsequent pages (perhaps that could have been used as a clue to determine when to create/clear the cache entry).
Environment
OS: Linux Debian 11: 5.10.0-19-amd64 SMP Debian 5.10.149-2 (2022-10-21) RestHeart version: 6.5.0 (JAR download variant) Java version: 17.0.4-amzn MongoDB version: 4.4.14 (Community Server)
Currently using the default config files with no modifications (other than the auth token).
Collection currently has 5 millions+ documents (but the query only retrieves around 15,000 of them).