 pevma
commented
3 years ago
pevma
commented
3 years ago Do you have traffic mirrored?
The health check passes comes back all green ? (selks-health-check_stamus)
Open cunhalg opened 3 years ago
pevma
commented
3 years ago Do you have traffic mirrored?
The health check passes comes back all green ? (selks-health-check_stamus)
 cunhalg
commented
3 years ago
cunhalg
commented
3 years ago Do you have traffic mirrored? - YES - I checked with TCPDUMP. The health check passes comes back all green ? (selks-health-check_stamus) - ALL GREEN
pevma
commented
3 years ago All dashboards are blank ? Can you please share the output of
ls -lh /var/log/suricata/It shows up as a total blank page. No menus nor nothing.
selks-user@SELKS:~$ ls -lh /var/log/suricata/
total 447M
drwxr-xr-x 2 logstash logstash 4.0K Jan 29 00:00 StatsByDate
drwxr-xr-x 2 logstash logstash 4.0K May  4  2020 certs
drwxr-xr-x 2 logstash logstash 4.0K Jan 28 02:00 core
-rw-r--r-- 1 logstash logstash 302M Jan 29 14:29 eve.json
drwxr-xr-x 2 logstash logstash 4.0K May  4  2020 files
-rw-r--r-- 1 logstash logstash 145M Jan 29 14:29 stats.log
-rw-r--r-- 1 root     root     2.3K Jan 29 02:00 suricata-start.log
-rw-r--r-- 1 root     root      58K Jan 29 02:00 suricata.log
selks-user@SELKS:~$  pevma
commented
3 years ago
pevma
commented
3 years ago Did you go through the first time setup procedure ok - specifically the nginx config - (confirm if the nginx config is up to date) https://github.com/StamusNetworks/SELKS/wiki/First-time-setup#nginx-config ?
cunhalg
commented
3 years ago i don't have these two entries on the nginx config
cat /etc/nginx/sites-available/selks6.conf
location /bootstrap.js { proxy_pass http://127.0.0.1:5601/bootstrap.js; proxy_redirect off; }
location ~ "^/([\d]{5}/.*)" { proxy_pass http://127.0.0.1:5601/$1; proxy_redirect off; }
pevma
commented
3 years ago I think it could help to add them in and restart the service as described.
cunhalg
commented
3 years ago seems to be ok. thks
 sanpichen
commented
3 years ago
sanpichen
commented
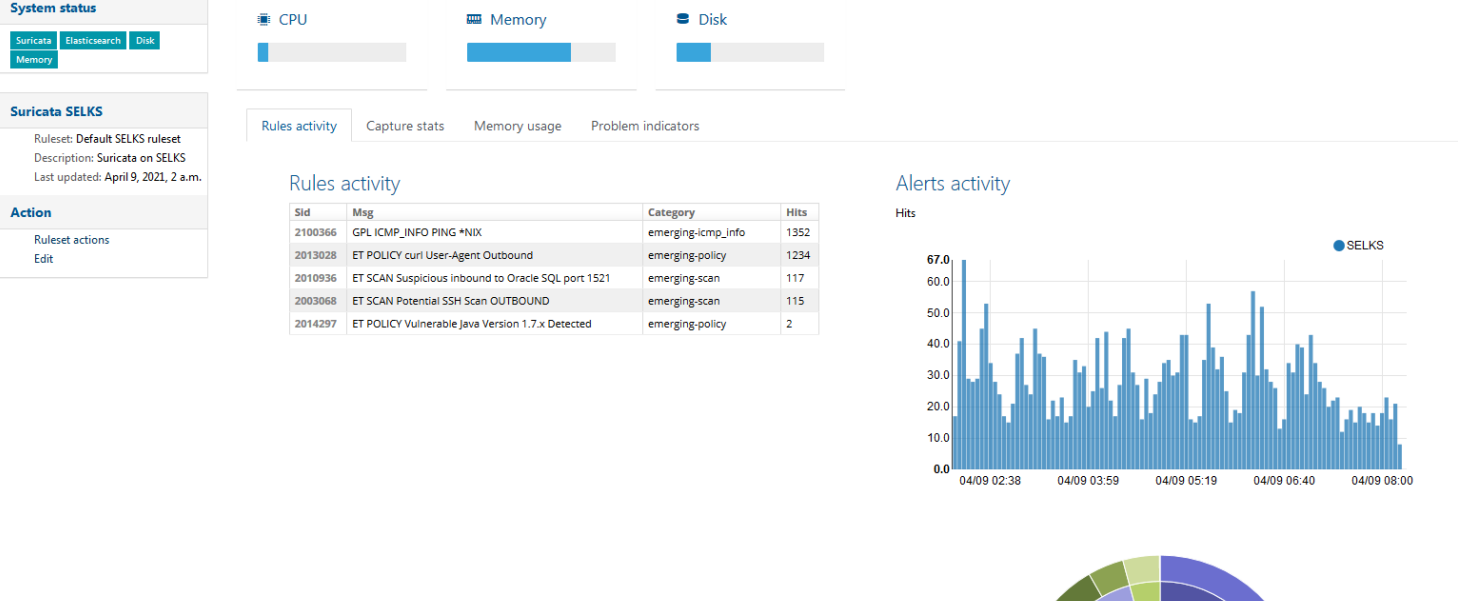
3 years ago I have done above,still can't get the elegant plots in sheets of "capture stats"、“memory usage ”、“problem indicators”,when cursor overlaps would get data .
################### root@SELKS:/usr/share/python/scirius# cat /etc/nginx/sites-available/selks6.conf server { listen 127.0.0.1:80; listen 443 default_server ssl; ssl_certificate /etc/nginx/ssl/scirius.crt; ssl_certificate_key /etc/nginx/ssl/scirius.key; server_name SELKS; access_log /var/log/nginx/scirius.access.log; error_log /var/log/nginx/scirius.error.log;
# https://docs.djangoproject.com/en/dev/howto/static-files/#serving-static-files-in-production
location /static/ { # STATIC_URL
    alias /var/lib/scirius/static/; # STATIC_ROOT
    expires 30d;
}

location /media/ { # MEDIA_URL
    alias /var/lib/scirius/static/; # MEDIA_ROOT
    expires 30d;
}

location /app/moloch/ {
    proxy_pass https://127.0.0.1:8005;
    proxy_redirect off;
}

location /plugins/ {
    proxy_pass http://127.0.0.1:5601/plugins/;
    proxy_redirect off;
}

location /dlls/ {
    proxy_pass http://127.0.0.1:5601/dlls/;
    proxy_redirect off;
}

location /socket.io/ {
    proxy_pass http://127.0.0.1:5601/socket.io/;
    proxy_redirect off;
}

location /dataset/ {
    proxy_pass http://127.0.0.1:5601/dataset/;
    proxy_redirect off;
}

location /translations/ {
    proxy_pass http://127.0.0.1:5601/translations/;
    proxy_redirect off;
}

location ^~ /built_assets/ {
    proxy_pass http://127.0.0.1:5601/built_assets/;
    proxy_redirect off;
}

location /ui/ {
    proxy_pass http://127.0.0.1:5601/ui/;
    proxy_redirect off;
}
location /spaces/ { proxy_pass http://127.0.0.1:5601/spaces/; proxy_redirect off; }
location /node_modules/ { proxy_pass http://127.0.0.1:5601/node_modules/; proxy_redirect off; }
location /bootstrap.js { proxy_pass http://127.0.0.1:5601/bootstrap.js; proxy_redirect off; }
location /internal/ { proxy_pass http://127.0.0.1:5601/internal/; proxy_redirect off; }
location ~ "^/([\d]{5}/.*)" { proxy_pass http://127.0.0.1:5601/$1; proxy_redirect off; }
location / { proxy_pass http://127.0.0.1:8000; proxy_read_timeout 600; proxy_set_header Host $http_host; proxy_set_header X-Forwarded-Proto https; proxy_redirect off; }
}
root@SELKS:/usr/share/python/scirius# selks-health-check_stamus ● suricata.service - LSB: Next Generation IDS/IPS Loaded: loaded (/etc/init.d/suricata; generated) Active: active (running) since Thu 2021-04-08 15:25:08 CST; 2h 18min ago Docs: man:systemd-sysv-generator(8) Process: 15348 ExecStart=/etc/init.d/suricata start (code=exited, status=0/SUCCESS) Tasks: 246 (limit: 9830) Memory: 8.8G CGroup: /system.slice/suricata.service └─15357 /usr/bin/suricata -c /etc/suricata/suricata.yaml --pidfile /var/run/suricata.pid --af-packet -D -v --user=logstash
4月 08 15:25:08 SELKS systemd[1]: Starting LSB: Next Generation IDS/IPS... 4月 08 15:25:08 SELKS suricata[15348]: Starting suricata in IDS (af-packet) mode... done. 4月 08 15:25:08 SELKS systemd[1]: Started LSB: Next Generation IDS/IPS. ● elasticsearch.service - Elasticsearch Loaded: loaded (/lib/systemd/system/elasticsearch.service; enabled; vendor preset: enabled) Active: active (running) since Thu 2021-04-08 10:06:58 CST; 7h ago Docs: https://www.elastic.co Main PID: 1474 (java) Tasks: 291 (limit: 9830) Memory: 35.1G CGroup: /system.slice/elasticsearch.service ├─1474 /usr/share/elasticsearch/jdk/bin/java -Xshare:auto -Des.networkaddress.cache.ttl=60 -Des.networkaddress.cache.negative.ttl=10 -XX:+AlwaysPreTouch -Xss1m -Djava.awt.headless=true … └─1830 /usr/share/elasticsearch/modules/x-pack-ml/platform/linux-x86_64/bin/controller
4月 08 10:06:13 SELKS systemd[1]: Starting Elasticsearch... 4月 08 10:06:58 SELKS systemd[1]: Started Elasticsearch. ● logstash.service - logstash Loaded: loaded (/etc/systemd/system/logstash.service; enabled; vendor preset: enabled) Active: active (running) since Thu 2021-04-08 10:06:00 CST; 7h ago Main PID: 957 (java) Tasks: 168 (limit: 9830) Memory: 1.9G CGroup: /system.slice/logstash.service └─957 /usr/share/logstash/jdk/bin/java -Xms2g -Xmx2g -XX:+UseConcMarkSweepGC -XX:CMSInitiatingOccupancyFraction=75 -XX:+UseCMSInitiatingOccupancyOnly -Djava.awt.headless=true -Dfile.enc…
4月 08 10:07:01 SELKS logstash[957]: [2021-04-08T10:07:01,501][INFO ][logstash.outputs.elasticsearch][main] ES Output version determined {:es_version=>7}
4月 08 10:07:01 SELKS logstash[957]: [2021-04-08T10:07:01,503][INFO ][logstash.outputs.elasticsearch][main] ES Output version determined {:es_version=>7}
4月 08 10:07:01 SELKS logstash[957]: [2021-04-08T10:07:01,503][WARN ][logstash.outputs.elasticsearch][main] Detected a 6.x and above cluster: the type event field won't be used …{:es_version=>7}
4月 08 10:07:01 SELKS logstash[957]: [2021-04-08T10:07:01,507][WARN ][logstash.outputs.elasticsearch][main] Detected a 6.x and above cluster: the type event field won't be used …{:es_version=>7}
4月 08 10:07:16 SELKS logstash[957]: [2021-04-08T10:07:16,122][INFO ][logstash.outputs.elasticsearch][main] Using mapping template from {:path=>"/etc/logstash/elasticsearch7-template.json"}
4月 08 10:07:16 SELKS logstash[957]: [2021-04-08T10:07:16,126][INFO ][logstash.outputs.elasticsearch][main] Using mapping template from {:path=>"/etc/logstash/elasticsearch7-template.json"}
4月 08 10:07:16 SELKS logstash[957]: [2021-04-08T10:07:16,239][INFO ][logstash.outputs.elasticsearch][main] Attempting to install template {:manage_template=>{"template"=>"logstash-", "version"=…
4月 08 10:07:16 SELKS logstash[957]: [2021-04-08T10:07:16,240][INFO ][logstash.outputs.elasticsearch][main] Attempting to install template {:manage_template=>{"template"=>"logstash-", "version"=…
4月 08 10:07:16 SELKS logstash[957]: [2021-04-08T10:07:16,263][INFO ][logstash.outputs.elasticsearch][main] Installing elasticsearch template to _template/logstash
4月 08 10:07:16 SELKS logstash[957]: [2021-04-08T10:07:16,266][INFO ][logstash.outputs.elasticsearch][main] Installing elasticsearch template to _template/logstash
Hint: Some lines were ellipsized, use -l to show in full.
● kibana.service - Kibana
Loaded: loaded (/etc/systemd/system/kibana.service; disabled; vendor preset: enabled)
Active: active (running) since Thu 2021-04-08 14:25:47 CST; 3h 18min ago
Docs: https://www.elastic.co
Main PID: 9525 (node)
Tasks: 11 (limit: 9830)
Memory: 531.2M
CGroup: /system.slice/kibana.service
└─9525 /usr/share/kibana/bin/../node/bin/node /usr/share/kibana/bin/../src/cli/dist --logging.dest=/var/log/kibana/kibana.log --pid.file=/run/kibana/kibana.pid
4月 08 14:25:47 SELKS systemd[1]: Started Kibana. ● evebox.service - EveBox Server Loaded: loaded (/lib/systemd/system/evebox.service; enabled; vendor preset: enabled) Active: active (running) since Thu 2021-04-08 10:06:00 CST; 7h ago Main PID: 956 (evebox) Tasks: 49 (limit: 9830) Memory: 42.2M CGroup: /system.slice/evebox.service └─956 /usr/bin/evebox server
4月 08 10:06:00 SELKS evebox[956]: 2021-04-08 10:06:00 INFO evebox::server::main: Using temporary in-memory configuration database 4月 08 10:06:00 SELKS evebox[956]: 2021-04-08 10:06:00 INFO evebox::sqlite::init: Initializing SQLite database (configdb) 4月 08 10:06:00 SELKS evebox[956]: 2021-04-08 10:06:00 INFO evebox::sqlite::init: Updating SQLite database to schema version 1 (configdb) 4月 08 10:06:00 SELKS evebox[956]: 2021-04-08 10:06:00 ERROR evebox::server::main: Failed to get Elasticsearch version, things may not work right: error=request: error sending req…d (os error 111) 4月 08 10:06:00 SELKS evebox[956]: 2021-04-08 10:06:00 INFO evebox::server::main: Starting server on 127.0.0.1:5636, tls=false 4月 08 12:50:20 SELKS evebox[956]: 2021-04-08 12:50:20 INFO evebox::server::main: Creating anonymous session for user from Some(127.0.0.1:56584) with name selks-user 4月 08 12:58:13 SELKS evebox[956]: 2021-04-08 12:58:13 INFO evebox::server::api::login: User logged out: selks-user 4月 08 12:58:13 SELKS evebox[956]: 2021-04-08 12:58:13 INFO evebox::server::main: Creating anonymous session for user from Some(127.0.0.1:58202) with name selks-user 4月 08 13:15:14 SELKS evebox[956]: 2021-04-08 13:15:14 INFO evebox::server::main: Creating anonymous session for user from Some(127.0.0.1:59240) with name selks-user 4月 08 14:57:29 SELKS evebox[956]: 2021-04-08 14:57:29 INFO evebox::server::main: Creating anonymous session for user from Some(127.0.0.1:36402) with name selks-user Hint: Some lines were ellipsized, use -l to show in full. ● molochviewer-selks.service - Moloch Viewer Loaded: loaded (/etc/systemd/system/molochviewer-selks.service; disabled; vendor preset: enabled) Active: inactive (dead) ● molochpcapread-selks.service - Moloch Pcap Read Loaded: loaded (/etc/systemd/system/molochpcapread-selks.service; disabled; vendor preset: enabled) Active: inactive (dead)
scirius RUNNING pid 12440, uptime 2:49:52 ii elasticsearch 7.12.0 amd64 Distributed RESTful search engine built for the cloud ii elasticsearch-curator 5.8.3 amd64 Have indices in Elasticsearch? This is the tool for you!\n\nLike a museum curator manages the exhibits and collections on display, \nElasticsearch Curator helps you curate, or manage your indices. ii evebox 1:0.13.0 amd64 no description given ii kibana 7.12.0 amd64 Explore and visualize your Elasticsearch data ii kibana-dashboards-stamus 2020122001 amd64 Kibana 6 dashboard templates. ii logstash 1:7.12.0-1 amd64 An extensible logging pipeline ii moloch 2.7.1-1 amd64 Moloch Full Packet System ii scirius 3.7.0-1 amd64 Django application to manage Suricata ruleset ii suricata 1:2021030201-0stamus0 amd64 Suricata open source multi-thread IDS/IPS/NSM system.
sanpichen
commented
3 years ago 
pevma
commented
3 years ago Is it just that or no data at all - for example no protocol logs/alerts etc?
sanpichen
commented
3 years ago Is it just that or no data at all - for example no protocol logs/alerts etc?
I don't think so.
####################
root@SELKS:~# curl -XGET 'http://localhost:9200/_cat/shards?v'
index shard prirep state docs store ip node
logstash-2021.04.03 0 p STARTED 16539 38.6mb 127.0.0.1 SELKS
logstash-http-2021.04.09 0 p STARTED 3179 3.3mb 127.0.0.1 SELKS
stats_v4 0 p STARTED 0 301b 127.0.0.1 SELKS
logstash-2021.04.07 0 p STARTED 16535 36.8mb 127.0.0.1 SELKS
dstats_v4 1 p STARTED 0 301b 127.0.0.1 SELKS
dstats_v4 0 p STARTED 0 301b 127.0.0.1 SELKS
.apm-custom-link 0 p STARTED 0 261b 127.0.0.1 SELKS
users_v7 0 p STARTED 2 7.7kb 127.0.0.1 SELKS
logstash-alert-2021.04.08 0 p STARTED 9044 9.1mb 127.0.0.1 SELKS
logstash-dhcp-2021.04.08 0 p STARTED 20907 2.3mb 127.0.0.1 SELKS
fields_v3 0 p STARTED 327 69.6kb 127.0.0.1 SELKS
hunts_v2 0 p STARTED 0 301b 127.0.0.1 SELKS
.kibana-event-log-7.12.0-000001 0 p STARTED 7 38kb 127.0.0.1 SELKS
logstash-snmp-2021.04.09 0 p STARTED 154 142kb 127.0.0.1 SELKS
logstash-flow-2021.04.08 0 p STARTED 911642 280.8mb 127.0.0.1 SELKS
.ds-ilm-history-5-2021.03.31-000001 0 p STARTED 127.0.0.1 SELKS
logstash-flow-2021.03.31 0 p STARTED 64 186.1kb 127.0.0.1 SELKS
logstash-anomaly-2021.04.09 0 p STARTED 5 53.7kb 127.0.0.1 SELKS
logstash-ftp-2021.04.08 0 p STARTED 77874 14mb 127.0.0.1 SELKS
logstash-2021.04.06 0 p STARTED 16327 36.9mb 127.0.0.1 SELKS
lookups_v1 0 p STARTED 0 301b 127.0.0.1 SELKS
dstats 0 p STARTED 1613 445.6kb 127.0.0.1 SELKS
logstash-2021.03.31 0 p STARTED 16044 35.4mb 127.0.0.1 SELKS
logstash-2021.04.04 0 p STARTED 16541 38.4mb 127.0.0.1 SELKS
logstash-http-2021.04.08 0 p STARTED 795971 286.6mb 127.0.0.1 SELKS
logstash-flow-2021.04.09 0 p STARTED 23830 8mb 127.0.0.1 SELKS
.kibana_7.12.0_001 0 p STARTED 77 4.4mb 127.0.0.1 SELKS
logstash-fileinfo-2021.04.08 0 p STARTED 1520553 456.2mb 127.0.0.1 SELKS
logstash-fileinfo-2021.04.09 0 p STARTED 1808 2.6mb 127.0.0.1 SELKS
.kibana_task_manager_1 0 p STARTED 5 22.2kb 127.0.0.1 SELKS
sequence_v3 0 p STARTED 1 3.1kb 127.0.0.1 SELKS
logstash-2021.04.08 0 p STARTED 16385 50.5mb 127.0.0.1 SELKS
logstash-2021.04.05 0 p STARTED 16535 38.3mb 127.0.0.1 SELKS
stats 0 p STARTED 1 25.6kb 127.0.0.1 SELKS
.async-search 0 p STARTED 0 362.9kb 127.0.0.1 SELKS
queries_v3 0 p STARTED 0 301b 127.0.0.1 SELKS
logstash-dns-2021.04.08 0 p STARTED 12315 1.7mb 127.0.0.1 SELKS
logstash-ssh-2021.04.09 0 p STARTED 2 36.5kb 127.0.0.1 SELKS
.kibana_1 0 p STARTED 1141 486.2kb 127.0.0.1 SELKS
logstash-snmp-2021.04.08 0 p STARTED 9185 2.8mb 127.0.0.1 SELKS
logstash-ftp_data-2021.04.08 0 p STARTED 26 154.5kb 127.0.0.1 SELKS
logstash-tls-2021.04.09 0 p STARTED 1901 835.5kb 127.0.0.1 SELKS
logstash-dhcp-2021.04.09 0 p STARTED 286 201.7kb 127.0.0.1 SELKS
logstash-ftp-2021.04.09 0 p STARTED 1438 451.4kb 127.0.0.1 SELKS
logstash-anomaly-2021.04.08 0 p STARTED 551 188.2kb 127.0.0.1 SELKS
.apm-agent-configuration 0 p STARTED 0 261b 127.0.0.1 SELKS
logstash-ssh-2021.04.08 0 p STARTED 79 163.2kb 127.0.0.1 SELKS
logstash-2021.04.01 0 p STARTED 16536 38.2mb 127.0.0.1 SELKS
.tasks 0 p STARTED 14 33.1kb 127.0.0.1 SELKS
.kibana_task_manager_7.12.0_001 0 p STARTED 10 2.1mb 127.0.0.1 SELKS
logstash-alert-2021.04.09 0 p STARTED 80 251.5kb 127.0.0.1 SELKS
logstash-2021.04.02 0 p STARTED 16536 39.2mb 127.0.0.1 SELKS
files_v6 1 p STARTED 1 4.8kb 127.0.0.1 SELKS
files_v6 0 p STARTED 0 301b 127.0.0.1 SELKS
logstash-2021.04.09 0 p STARTED 182 1.2mb 127.0.0.1 SELKS
logstash-tls-2021.04.08 0 p STARTED 15306 4.8mb 127.0.0.1 SELKS
It seems you have data - snmp/ftp/tls protocols plus alerts.
logstash-alert-2021.04.09           0     p      STARTED      80 251.5kb 127.0.0.1 SELKS
...
logstash-snmp-2021.04.08            0     p      STARTED    9185   2.8mb 127.0.0.1 SELKS
logstash-ftp_data-2021.04.08        0     p      STARTED      26 154.5kb 127.0.0.1 SELKS
logstash-tls-2021.04.09
Can you open the SN-ALERT dashboard in Kibana and see if it populates?
sanpichen
commented
3 years ago kibana not presents any selks dashborads even i reset it.
I just follow https://github.com/StamusNetworks/KTS7 to terminate it now.

pevma
commented
3 years ago ok -seem populating now. Did the first time setup finish ok and without errors? ( https://github.com/StamusNetworks/SELKS/wiki/First-time-setup#first-time-setup )
sanpichen
commented
3 years ago yes ,Exited with ERROR "AttributeError: 'Settings' object has no attribute 'KIBANA7_DASHBOARDS_PATH'" before I set "KIBANA7_DASHBOARDS_PATH = "/opt/selks/kibana7-dashboards/" " in /etc/scirius/local_settings.py selks-first-time-setup_stamus.log
pevma
commented
3 years ago Have you adjusted those config settings before? It should work outside the box. Can you try to reset the dashboards - https://github.com/StamusNetworks/SELKS/wiki/How-to-load-or-update-dashboards#from-scirius ?
 LxKxC
commented
3 years ago
LxKxC
commented
3 years ago I also encountered this error after running upgrade-selks successfully. During the upgrade process, I was asked to choose yes or no. The yes I selected for all may have something to do with this. I also noticed that the dashboard is not a blank page. Right-clicking the source code in the browser will find that there are actually a lot of html content. The dashboard just looks blank, but the elements may not be displayed. Maybe it is a compatibility issue?
LxKxC
commented
3 years ago The problem is solved, I directly replaced mine with the selks6.conf configuration you provided (https://github.com/StamusNetworks/SELKS/wiki/Kibana-did-not-load-properly)
After following all the steps without any errors i'm still not able to have any dashboards. Can you help understand why?