Open Githeo opened 3 years ago
Hi,
Thanks for your kind words!
Have run through the file that you have provided and I am getting exact same values for MFCC and melspectrograms between Librosa and jLibrosa.
Python Code that I used is below:
`y, sr = librosa.load("/audioFiles/horn_22050Hz.wav", sr=None)
print(y)
mfccs = librosa.feature.mfcc(y, sr=sr, n_mfcc=40)
mel_spectrogram = librosa.feature.melspectrogram(y,sr=sr, n_fft=2048, hop_length=256, n_mels=128) `
Java code:
float audioFeatureValues [] = jLibrosa.loadAndRead(audioFilePath, defaultSampleRate, defaultAudioDuration); float [][] melSpectrogram = jLibrosa.generateMelSpectroGram(audioFeatureValues, sampleRate, 2048, 128, 256) float[][] mfccValues = jLibrosa.generateMFCCFeatures(audioFeatureValues, sampleRate, 40);
From your code, I observe you have used some normalization on Python code. Apply those normalizations on the magnitude values you obtain in Java code and check on the values.
Pls let me know if you face issues on them.
Thanks @VVasanth it's ok now.
Tell me, do you planned to include also the librosa delta (actually a savitzky golay filter) the your lib. Java has some pre-boiled SGFilter class but the results is not exactly the same (especially on the borders) and very different for greater order.
Hey Githeo,
did you manage to find a solution for the delta? I also need this in java and can't find anything online.
Try this:
import org.apache.commons.math3.analysis.interpolation.SplineInterpolator;
import org.apache.commons.math3.analysis.polynomials.PolynomialSplineFunction;
public static double[][] delta(double[][] X, int order) { // Compute the deltas of the input matrix X // X is a 2D array of shape (n_samples, n_features) // order is the order of the delta coefficients (usually 1 or 2) int n_samples = X.length; int n_features = X[0].length;
double[][] deltas = new double[n_samples][n_features];
for (int i = 0; i < n_samples; i++) {
int t1 = Math.max(0, i - order);
int t2 = Math.min(n_samples - 1, i + order);
double[] x = new double[t2 - t1 + 1];
double[][] y = new double[t2 - t1 + 1][n_features];
for (int j = t1; j <= t2; j++) {
x[j - t1] = j;
for (int k = 0; k < n_features; k++) {
y[j - t1][k] = X[j][k];
}
}
SplineInterpolator interpolator = new SplineInterpolator();
PolynomialSplineFunction[] splines = new PolynomialSplineFunction[n_features];
for (int k = 0; k < n_features; k++) {
splines[k] = interpolator.interpolate(x, y[0]);
}
double[] dx = new double[n_features];
for (int k = 0; k < n_features; k++) {
dx[k] = splines[k].derivative().value(i);
}
deltas[i] = dx;
}
return deltas;
}
public static double[][] delta(double[][] X, int order) { // Compute the deltas of the input matrix X // X is a 2D array of shape (n_samples, n_features) // order is the order of the delta coefficients (usually 1 or 2) int n_samples = X.length; int n_features = X[0].length;
double[][] deltas = new double[n_samples][n_features];
double[] x = new double[2 * order];
for (int i = 0; i < 2 * order; i++) {
x[i] = i - order;
}
for (int i = 0; i < n_samples; i++) {
int t1 = Math.max(0, i - order);
int t2 = Math.min(n_samples - 1, i + order);
double[][] y = new double[t2 - t1 + 1][n_features];
for (int j = t1; j <= t2; j++) {
for (int k = 0; k < n_features; k++) {
y[j - t1][k] = X[j][k];
}
}
double[] dx = new double[n_features];
for (int k = 0; k < n_features; k++) {
double[] yk = new double[t2 - t1 + 1];
for (int j = t1; j <= t2; j++) {
yk[j - t1] = X[j][k];
}
double[] w = new double[2 * order];
double sum = 0;
for (int j = 0; j < 2 * order; j++) {
w[j] = (j - order) * yk[j];
sum += w[j] * w[j];
}
if (sum == 0) {
dx[k] = 0;
} else {
double factor = 1.0 / (2 * sum);
double delta = 0;
for (int j = 0; j < 2 * order; j++) {
delta += w[j] * x[j];
}
dx[k] = factor * delta;
}
}
deltas[i] = dx;
}
return deltas;
}
Hi @VVasanth,
thank you for you work and initiative. Indeed there's something missing in Java/Kotlin when dealing with audio signals.
I tried to use jliborsa hoping to get the same results as librosa, but I didn't succeed so far. I have the following wav file and I :
horn_22050Hz.wav.zip
From that I want to get the log-melspectrogram image. In python I use the following:
The spectrogram image I obtain is the following.![image](https://user-images.githubusercontent.com/8645265/94268377-5d340680-ff3d-11ea-981a-0cac650ccc8b.png)
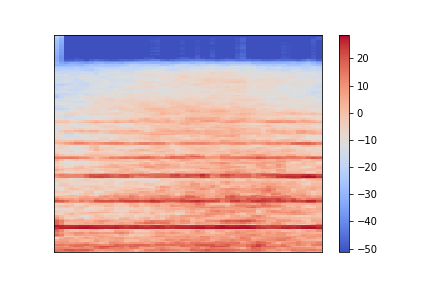
Now I'd like to get the same image (same mfcc values) with jlibrosa:
Plotting jLibrosaMFCC this is what I get:
Not exactly the same spectrogram, though the size is the same (128, 53).