Tim55667757 / TKSBrokerAPI

TKSBrokerAPI is the trading platform for automation and simplifying the implementation of trading scenarios, as well as working with Tinkoff Invest API server via the REST protocol. The TKSBrokerAPI platform may be used in two ways: from the console, it has a rich keys and commands, or you can use it as Python module.
https://tim55667757.github.io/TKSBrokerAPI/
Apache License 2.0
25 stars 9 forks source link

For `--history` key add possibility to view html chart with `PriceGenerator` package #6

Closed Tim55667757 closed 1 year ago

Tim55667757 commented 2 years ago

Add key --render-chart with two possible parameter: interact (i) or non-interact (ni).

If you select interact then chain of candlesticks will render as interactive Bokeh chart. See examples: https://github.com/Tim55667757/PriceGenerator#overriding-parameters

If you select non-interact then chain of candlesticks will render as not interactive Google Candlestick chart. See examples: https://github.com/Tim55667757/PriceGenerator#statistics-and-chart-on-a-simple-template

Tim55667757 commented 
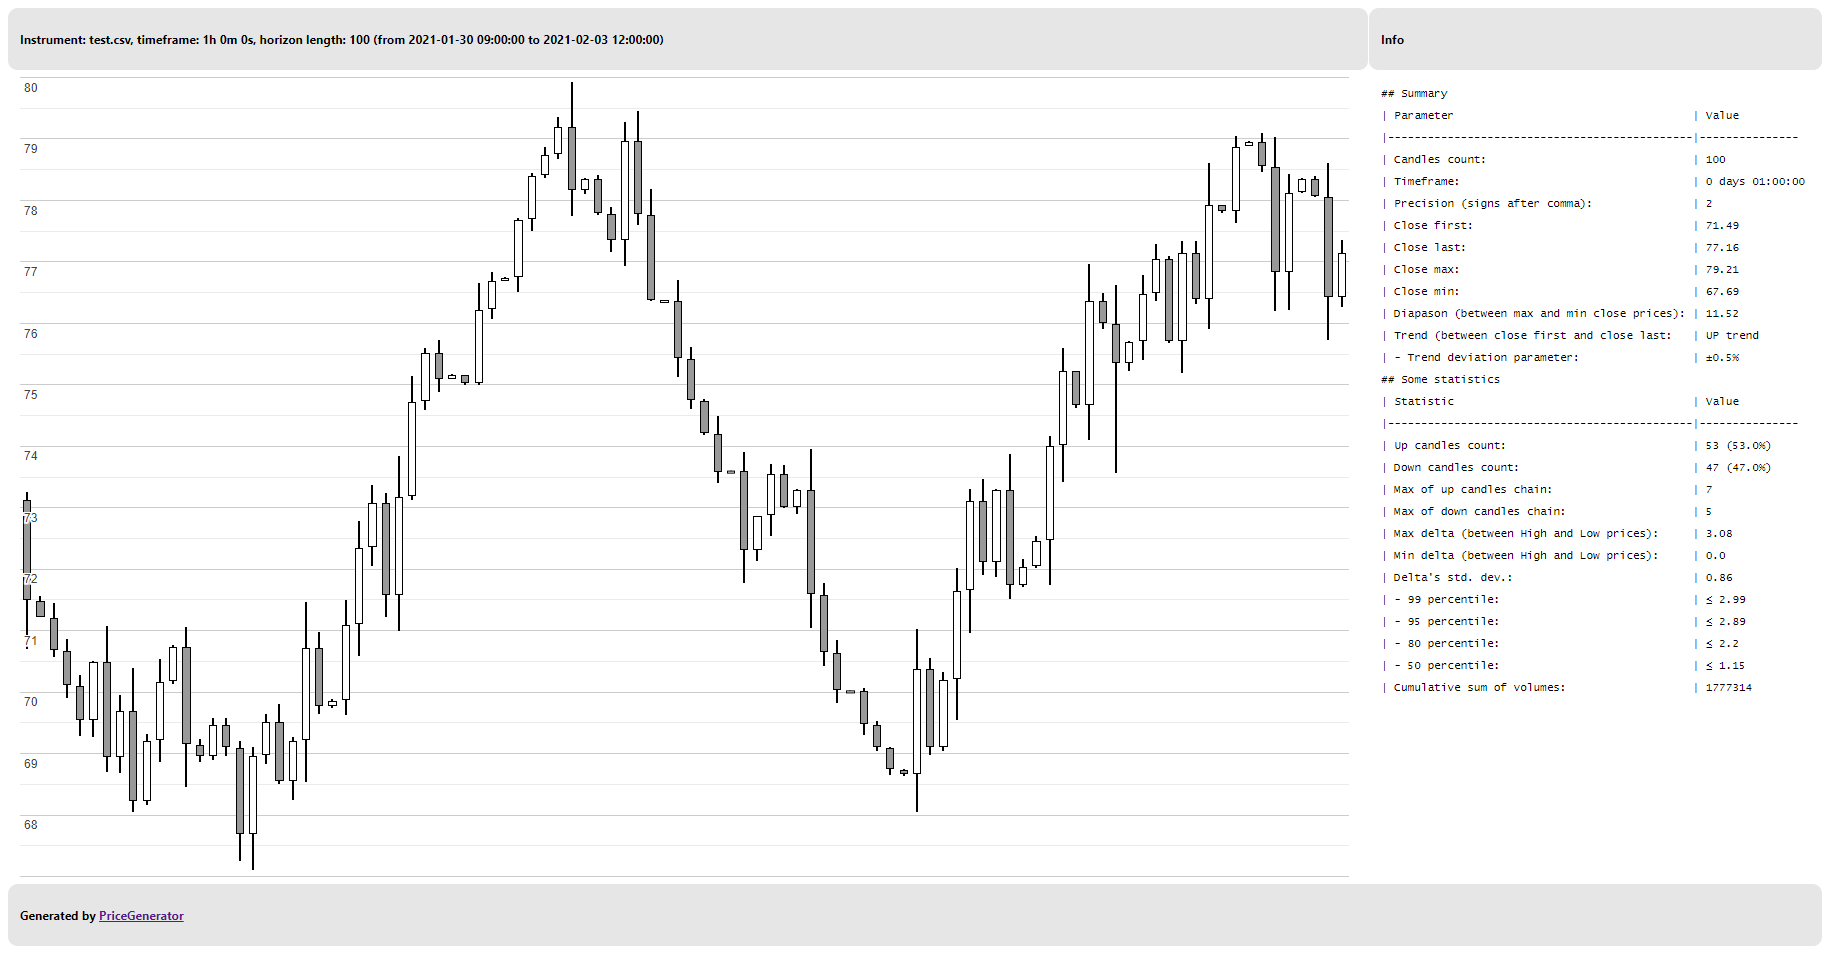
1 year ago

When launched with the --history key, the ability to specify an additional key --render-chart and generates interactive or static charts using the PriceGenerator library was added.

Also, you can build charts for previously saved csv-files with the candles history. To do this, you need to specify the --render-chart key with the new implemented key for loading data from file: --load-history.

Test build: https://app.travis-ci.com/github/Tim55667757/TKSBrokerAPI/builds/256801023 PyPI: https://pypi.org/project/tksbrokerapi/1.3.dev77/ For testing use 1.3.dev77 version: pip install tksbrokerapi==1.3.dev77

Tim55667757 commented 1 year ago

The generated graphs of various types will look like below. By default, they are saved to the index.html file. The charts additionally display some statistical values and indicators, however, they are presented only for a quick review of the price behavior in a given range. To conduct full analytical research and technical analysis, it is recommended to use other professional tools.

Interactive chart Static chart

Real examples

The first example of uploaded data can be found in the file ./docs/media/GAZP_hour.csv, and the generated chart in the file ./docs/media/index_GAZP_google_chart.html.

The second example of uploaded data can be found in the file ./docs/media/POSI_15min.csv, and the generated chart in the file ./docs/media/index_POSI_bokeh_chart.html.