Closed philipc2 closed 9 months ago
@dcherian @rajeeja @paullric @erogluorhan
Any comments or suggestions? I think it might be worth discussing this topic during one of our bi-weekly meetings since there is a lot of design decisions we need to make before we can start working on it.
@dcherian @rajeeja @paullric @erogluorhan
Any comments or suggestions? I think it might be worth discussing this topic during one of our bi-weekly meetings since there is a lot of design decisions we need to make before we can start working on it.
What are the dependencies of PolyMesh? Is setting this up with SciPy or MPL's triangulation easy? IMO MPL has been the most reliable over the years.
@rajeeja
PolyMesh is written around Datashader, with the main dependencies being Shapely (since PyGEOS merged with Shapely), Spatial Pandas, and GeoViews. Shapely2.0 is currently in an alpha release, and is still merging a lot of the PyGEOS work as we speak.
Starting off with triangulation support using one of the SciPY or MPL methods would be a good start. We wouldn't be able to visualize large grids very efficiently, however it would be very easy to implement once we settle on a design.
This sounds most excellent @philipc2.
I keep coming back to the comments in https://github.com/UXARRAY/uxarray/discussions/46#discussioncomment-2747480 ... I think it's important for any unstructured viz to reflect (or at least have a boolean switch) to reflect the underlying mesh and cell topology.
So for the latter (Calling .plot() on a Grid object with an argument for data variables), I would consider that a relatively desirable feature that such contour maps properly show the underlying mesh.
A potentially relevant example @cdeciampa shared with me this AM is: https://psyplot.github.io/examples/maps/example_ugrid.html
Note https://psyplot.github.io/examples/_images/maps_example_ugrid_18_0.png, where the cells with more than 3 edges are correctly filled as one scalar value (it's possible the quads are really just two triangles glued together, I haven't dug deep enough into the source).
One of the benefits of having a full grid description (i.e., having cell edges and vertices versus just lat/lon points) means viz tools using the description can be faithful to the computational mesh!
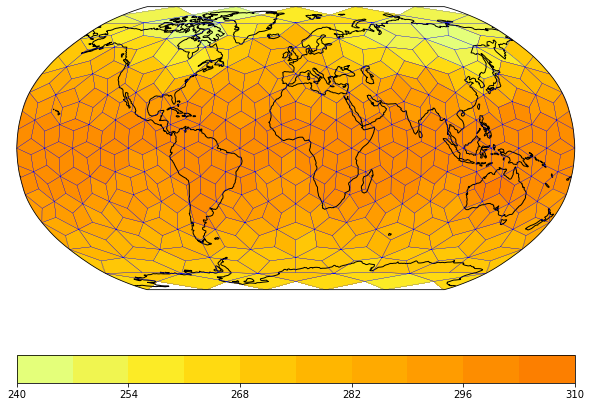
Similar to Xarray, directly allow for plotting from a Grid Object (compared to a DataArray).
Proposed Functionality
.plot()
on aGrid
object with no data variables (only grid info) would render an unfilled mesh.plot()
on aGrid
object with an argument for data variables, indexing, etc, would render a filled mesh according to the user inputsPolyMesh Specific
Grid
object to reduce computation time on repeated plots (ex. plotting multiple data variables on the same mesh)