Unidata / MetPy

MetPy is a collection of tools in Python for reading, visualizing and performing calculations with weather data.
https://unidata.github.io/MetPy/
BSD 3-Clause "New" or "Revised" License
1.24k stars 413 forks source link

I followed the MetPy Monday for Radar Animation Exactly But Got a Random Blank Subplot #2453

Closed edrewitz closed 2 years ago

edrewitz commented 2 years ago

What went wrong?

Hi! I was following the MetPy Monday Radar Animation video exactly but it added a random blank subplot below the animator buttons. I'm not sure why this is as in my code I only created one subplot. Please see attached screenshot. Thanks!
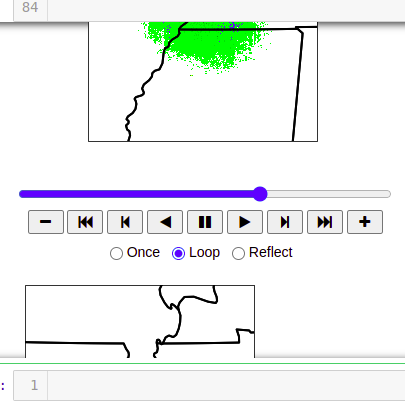
 Screenshot from 2022-04-23 14-14-22

Operating System

Linux

Version

metpy 1.3.0

Python Version

Python 3.9.12

Code to Reproduce

# Imports needed packages
from datetime import datetime, timedelta
import cartopy
import matplotlib.pyplot as plt
from metpy.plots import ctables, add_timestamp, add_metpy_logo
import numpy as np
from siphon.catalog import TDSCatalog
from siphon.cdmr import Dataset
from siphon.radarserver import RadarServer

# Data Request
cat = TDSCatalog('http://thredds.ucar.edu/thredds/radarServer/catalog.xml')
rs = RadarServer(cat.catalog_refs['NEXRAD Level III Radar from IDD'].href)

# Queries
query = rs.query()
now = datetime.utcnow()
query.stations('NQA').time_range(now - timedelta(hours=2), now).variables('N0Q')
query_cat = rs.get_catalog(query)

def plot_radar(data, field_name):
    # Gets range, azimuth and field name
    rng = data.variables['gate'][:]
    az = data.variables['azimuth'][:]
    ref = data.variables[field_name][:]

    distance_in_degrees = 2
    ax.set_extent([data.RadarLongitude - distance_in_degrees,
                  data.RadarLongitude + distance_in_degrees,
                  data.RadarLatitude - distance_in_degrees,
                  data.RadarLatitude + distance_in_degrees])

    x = rng * np.sin(np.deg2rad(az))[:, None]
    y = rng * np.cos(np.deg2rad(az))[:, None]

    norm, cmap = ctables.registry.get_with_range('NWSReflectivity', -30, 100)

    mesh = ax.pcolormesh(x, y, ref, cmap=cmap, norm=norm, zorder=0)

    return mesh

field_name = 'BaseReflectivityDR'

base_file = query_cat.datasets[0].remote_access()

proj = cartopy.crs.LambertConformal(central_longitude=base_file.RadarLongitude,
                                         central_latitude=base_file.RadarLatitude)

state_borders = cartopy.feature.NaturalEarthFeature(category='cultural', name='admin_1_states_provinces_lakes',
                                                   scale='50m', facecolor='none')

fig = plt.figure(figsize=(6,6))
ax = fig.add_subplot(1, 1, 1, projection=proj)

artists = []

ax.add_feature(state_borders, edgecolor='black', linewidth=2)

for ds_name in sorted(query_cat.datasets):
    ds = query_cat.datasets[ds_name]
    data = Dataset(ds.access_urls['CdmRemote'])

    field_name = [var.name for var in data.variables.values()
                 if var.ndim >= 2 and not var.name.endswith('RAW')][0]

    text = ax.text(0.5, 1.02, data.time_coverage_start, ha='center',
                  transform=ax.transAxes)

    mesh = plot_radar(data, field_name)

    artists.append([text, mesh])

plt.rcParams['animation.html'] = 'jshtml'

from matplotlib.animation import ArtistAnimation

anim = ArtistAnimation(fig, artists, interval=100)
anim

Errors, Traceback, and Logs

No response

dopplershift commented 2 years ago

What you're seeing is IPython's matplotlib integration, which automatically displays any figures newly created within a cell. This is separate from you asking for the animation to be rendered to html with the last anim line in your cell. This StackOverflow question gives a variety of approaches to disable showing the figure. I was personally able to get the figure to not show by adding plt.ioff() before creating the ArtistAnimation.