Using the prometheus metrics datasource from grafana leads to weird behavior on irate() and rate() for a metric. The raw metric is perfectly constant on the plateau, but rate and irate are non-zero and very different. I am guessing the value of the rollups during that time are the last non-zero values before the plateau, but I don't see why they are not getting reset to 0 once the metric stops varying.
The query seems perfectly fine in the query inspector, and the displayed data in the graph is the same as the one reported as returned by vmselect, with timestamps increasing in 120s intervals (scrape_interval is 20s).
raw metric:
rate:
irate:
To Reproduce
Compute rate() or irate() of a constant but non-zero counter metric
Describe the bug
Using the prometheus metrics datasource from grafana leads to weird behavior on irate() and rate() for a metric. The raw metric is perfectly constant on the plateau, but rate and irate are non-zero and very different. I am guessing the value of the rollups during that time are the last non-zero values before the plateau, but I don't see why they are not getting reset to 0 once the metric stops varying.
The query seems perfectly fine in the query inspector, and the displayed data in the graph is the same as the one reported as returned by vmselect, with timestamps increasing in 120s intervals (scrape_interval is 20s).
raw metric: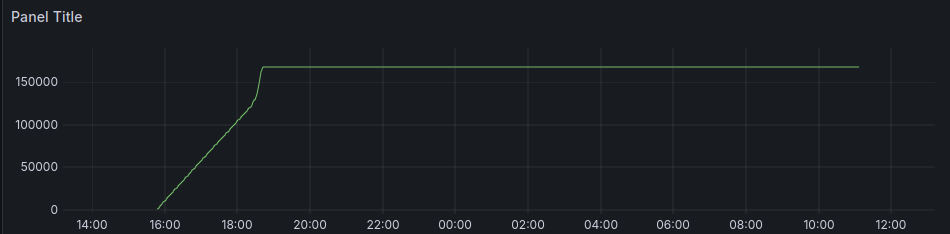
rate: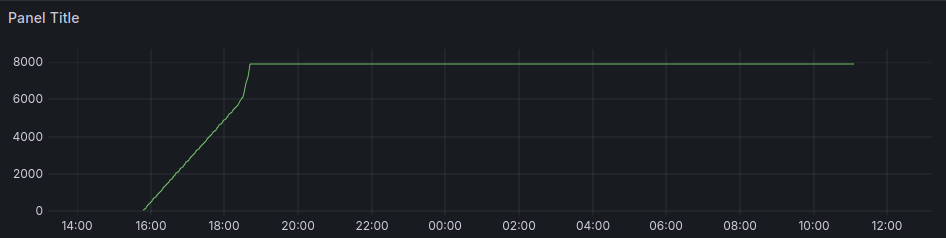
irate: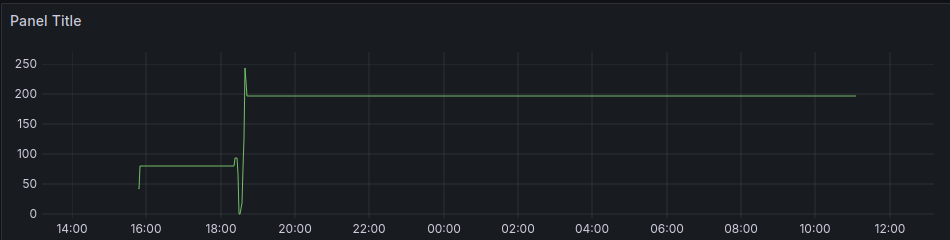
To Reproduce
Compute rate() or irate() of a constant but non-zero counter metric
Version
victoria metrics cluster on k3s, version 1.99.0
Logs
No response
Screenshots
No response
Used command-line flags
No response
Additional information
No response