Hi @johnnynunez, nvitop is built on top of the NVIDIA Management Library (NVML), which is instantly usable after installing the NVIDIA driver. The only APIs from NVML to get GPU utilization rates are:
Per device:
nvmlDeviceGetUtilizationRates(%GPU + %MEM bandwidth)nvmlDeviceGetEncoderUtilization(%ENC)nvmlDeviceGetDecoderUtilization(%DEC)
Per process:
nvmlDeviceGetProcessUtilization(%SM (GPU) + %MEM bandwidth + %ENC + %DEC)
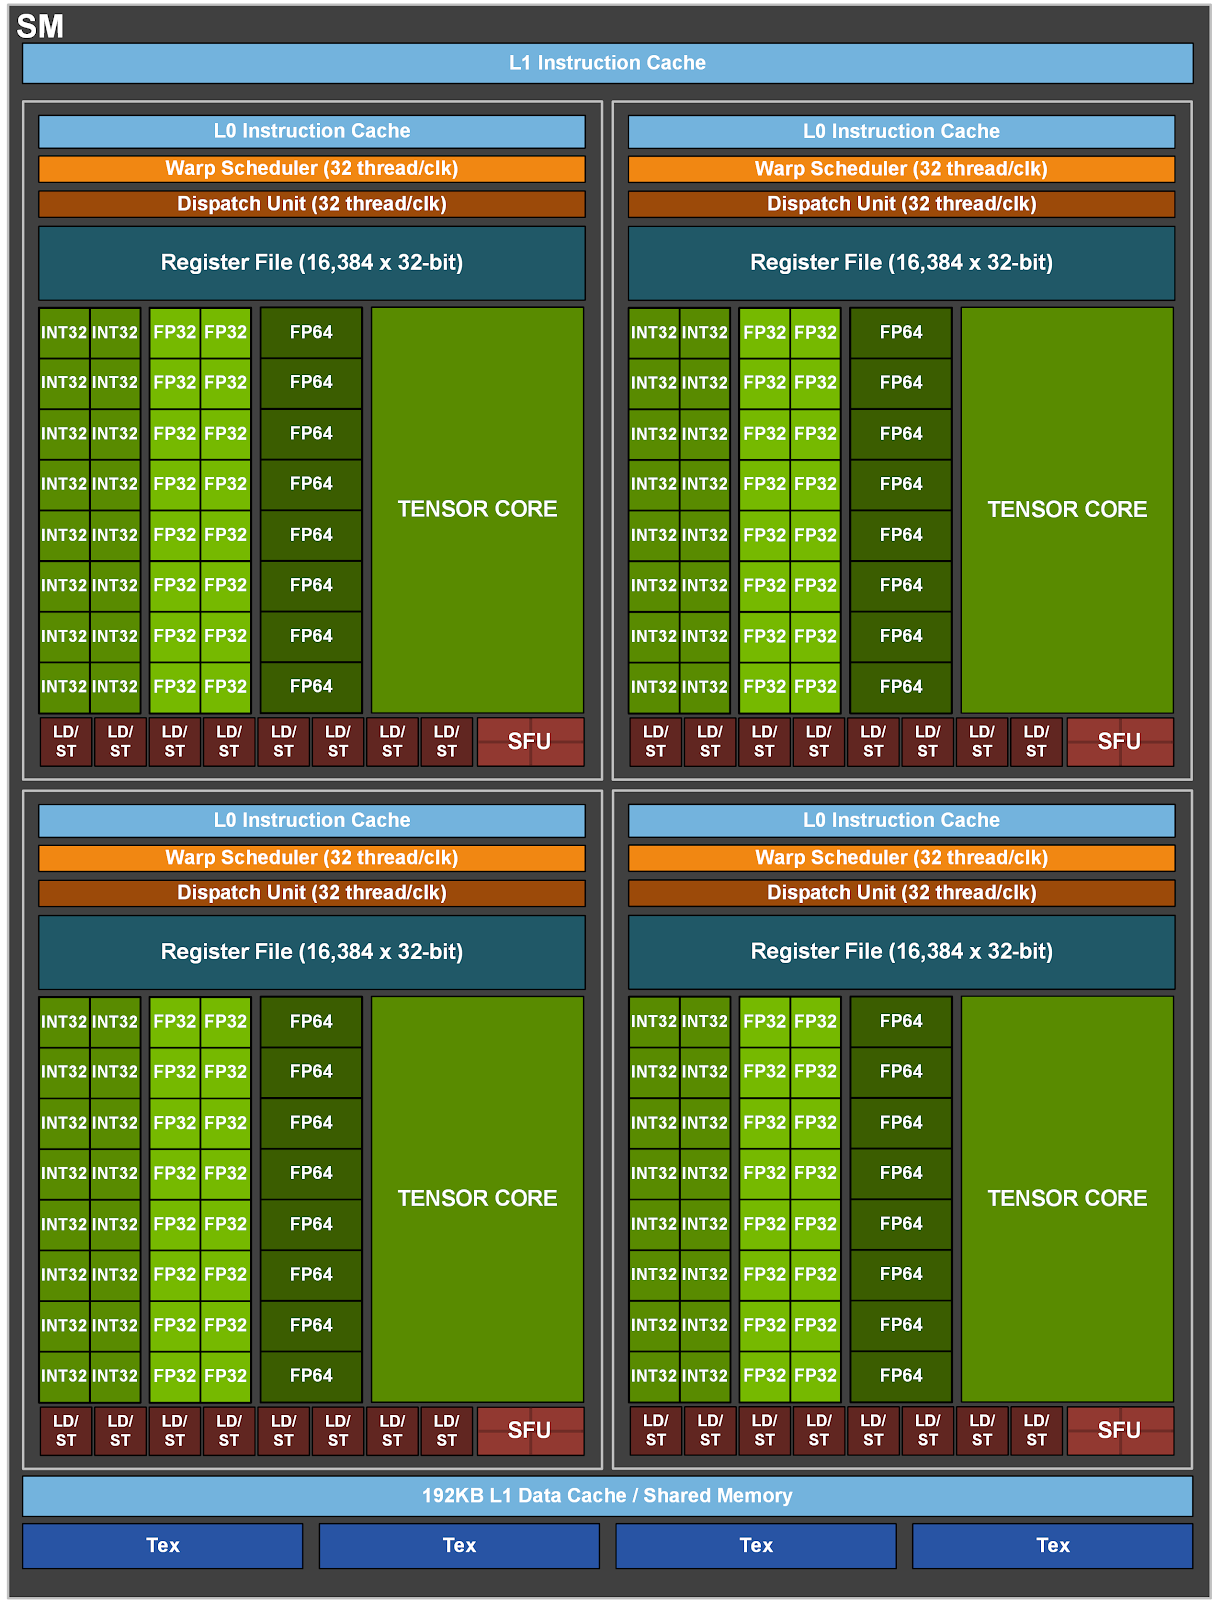
nvitop do provide per process GPU utilization usage in the %SM column. I found this blog:
 The GA100 streaming multiprocessor (SM).
said:
A100 GPU streaming multiprocessor
The new streaming multiprocessor (SM) in the NVIDIA Ampere architecture-based A100 Tensor Core GPU significantly increases performance, builds upon features introduced in both the Volta and Turing SM architectures, and adds many new capabilities.
The SM unit is consist of multiple tensor cores. Does this resolve your request?
The NVML can only retrieve the SM (streaming multiprocessor) usage in total rather than fine-grained details for the tensor cores. If you want to profile your program, I think using nvprof is the best practice as NVIDIA documented.

Nvidia told me to use nvidia profiler to monitor the tensor cores or nvprof. But could you add to this great tool to know if my RTX 3090 is really using the tensor cores?
https://developer.nvidia.com/blog/using-nsight-compute-nvprof-mixed-precision-deep-learning-models/