 GuangchuangYu
commented
3 years ago
GuangchuangYu
commented
3 years ago 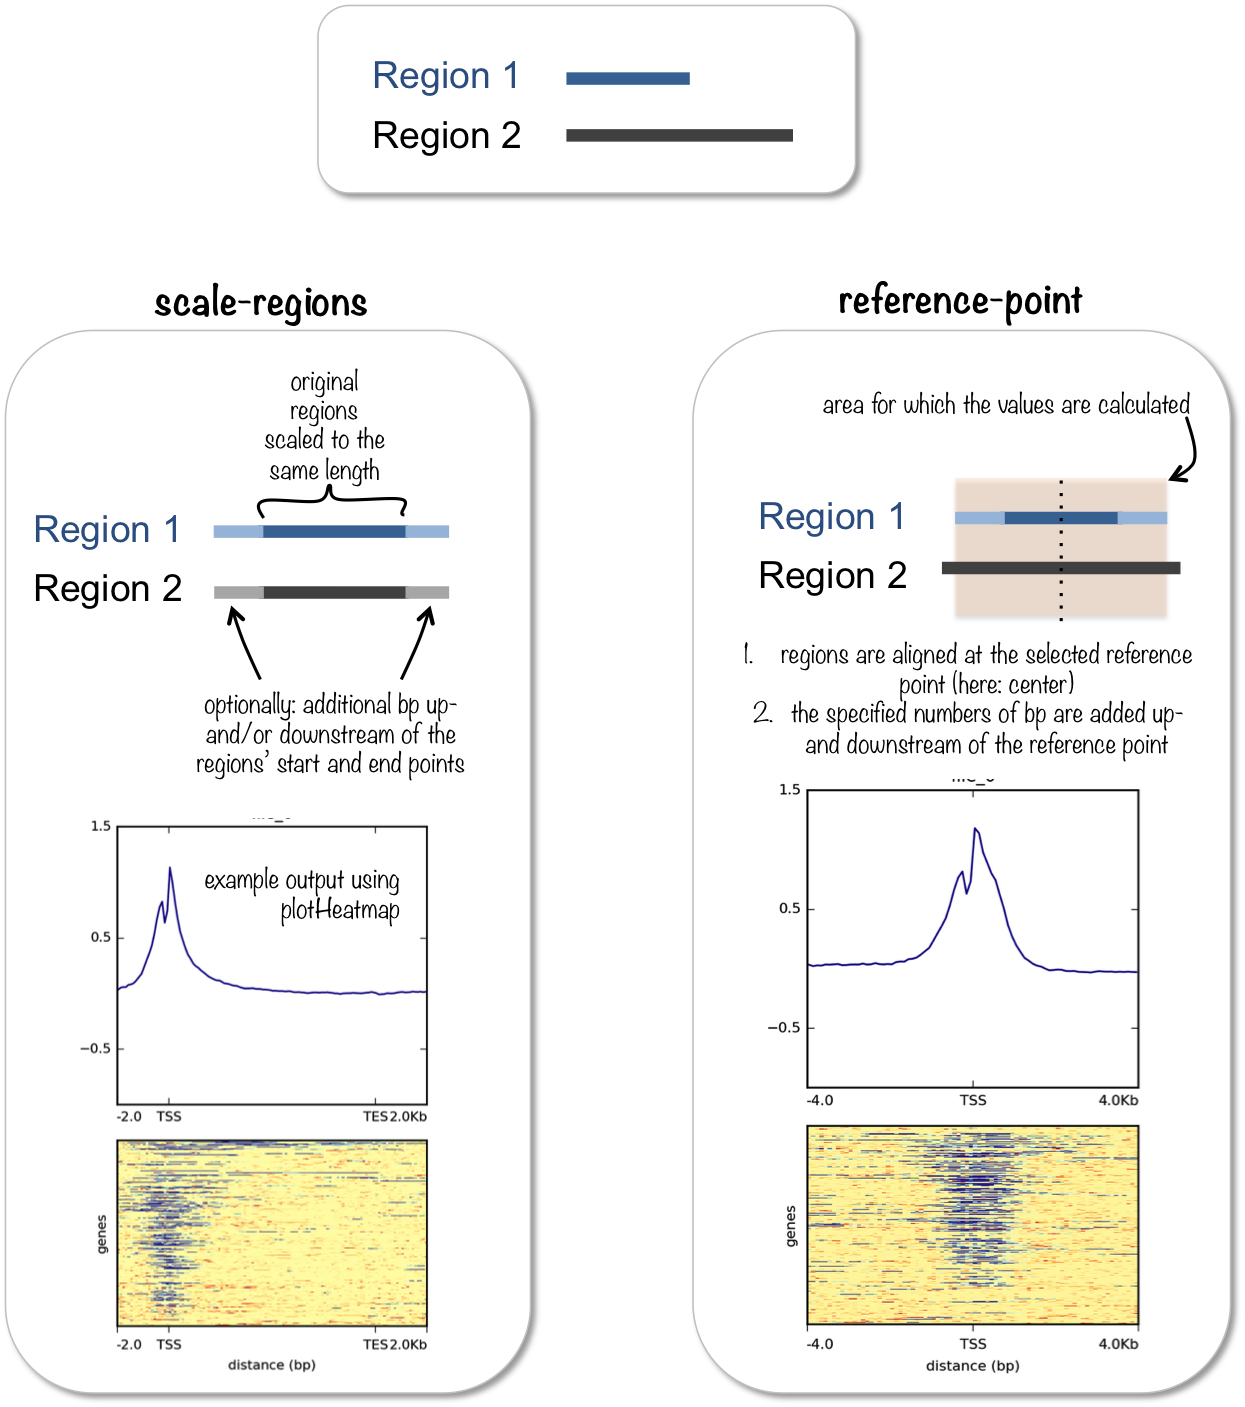
如果TSS上面还有序列,TES后面还有序列呢?有没有example?你不需要反复关闭PR,又开PR,可以不断commit新的到同一个PR中。
Closed MingLi-929 closed 2 years ago
GuangchuangYu
commented
3 years ago
如果TSS上面还有序列,TES后面还有序列呢?有没有example?你不需要反复关闭PR,又开PR,可以不断commit新的到同一个PR中。
GuangchuangYu
commented
3 years ago 
像你最后一个图,看着感觉在TSS和TES的附近就是会有一个峰,那么延伸一下,再画个图,是肯定的。
GuangchuangYu
commented
2 years ago 为什么我后面没有来看你这个PR,应该你后面commit了之后,没有回复,没有给我反馈。

像这个promoter的,是等长的,我希望等长的情况下,那些4分位置,写的是实际的距离,多少bp。

如果upstream和downstream是数字,延长指定的长度,如果是画基因体的话,延长的部分又是等长的,参照第一点,延长部分的label,用实际数字。
upstream和downstream参数可以接收相对值,用ggplot2::rel()参入,你测试一个是rel对象就是相对值了,那么每一个基因,延长基因体相对应比值的长度。
GuangchuangYu
commented
2 years ago 如果upstream和downstream是数字,延长指定的长度,如果是画基因体的话,延长的部分又是等长的,参照第一点,延长部分的label,用实际数字。
upstream和downstream参数可以接收相对值,用ggplot2::rel()参入,你测试一个是rel对象就是相对值了,那么每一个基因,延长基因体相对应比值的长度。
我最后的这两句话,你就没看。你的示例中只有upstream=0.2,我说的是upstream = rel(0.2),因为这样可以区分相对值和绝对值。
然后你的示例里就没有绝对值的,比如upstream=1000,那么上游就延伸1000bp,然后上游的x axis label,就写1000,按实际数字写。
GuangchuangYu
commented
2 years ago 以及不要每次的commit message都是个update,要写有意义的commit msg.
GuangchuangYu
commented
2 years ago f <- function(n) {
if(!is.numeric(n)) stop('n should be numeric value')
if (inherits(n, 'rel')) {
base <- 100 # ?
return(as.numeric(n * base))
}
return(n)
}ggplot2::rel() 就是一个数字,加了一个rel的类属性,用于区分是绝对值还是相对值。在ggplot2中各种size的参数,你可以用实际值指定大小,你也可以用rel指定相对大小(缩放倍数,由于默认值不是rel(1),所以你rel(2)不是当前看到的放大两倍)。
> f(rel(3))
[1] 300
> f(3 )
[1] 3
> is.numeric(rel(3))
[1] TRUE
> class(rel(3))
[1] "rel"-1000, 1000这些label,写-1000bp, 1000bp。
我觉得is_TSSregion这个参数是可以去掉的。
你在生成的tag matrix里,给它加个属性,这个tag matrix是什么,这个由windows参数传入的东西确定,所以是getBioRegion和getPromoters的输出加个属性,然后传入给getTagMatrix的时候,把这个属性转加到getTagMatrix的输出中,然后在画图的时候,就可以区分是什么区域画图,不仅仅像你这个is_TSSregion只区分是否TSS了,可以有不同的,比如是否是基因体,是否是可变剪切位点等等。
> x = matrix(rnorm(100), ncol=10)
> attr(x, 'type') = 'TSS'
> attr(x, 'type')
[1] "TSS"
> rowMeans(x)
 [1] -0.35381022 -0.40562894 -0.06152096  0.20289575  0.21946214  1.13116883
[7] -0.54431412 0.20081212 0.28930633 0.13965037你尝试一下用attr去加属性。
GuangchuangYu
commented
2 years ago 更新一下vignette,把你之前做的功能都写进去。
This pull request is to add the function of plotting bioregion including genebody, TSS, 5UTR_SS. The basic idea is to scale the bioregions having different lengths to the equal length, the idea was derived from the function of deeptools. (https://deeptools.readthedocs.io/en/develop/content/tools/computeMatrix.html)
The way to reach the goal of scaling bioregion is to devide the region into the same amounts of boxes. Because the amount of boxes is equal, the bioregion can be thought of scaling to equal length.So the parameter
boxis set to reach this goal.Four functions are created to reach this goal.
getGeneBody()can get genebody region2.
getBioRegionMatrix()can calculate the bioregion matrix3.
plotBioRegion()can plot with matrix derived bygetGenebodyMatrix()plotBioRegion2()supports plotting region automaticallyplotBioRegion2 <- function(peak, weightCol = NULL, TxDb = NULL, body_type = NULL, start_region_by = NULL, xlab = "Scaled Genomic Region (5'->3')", ylab = "Peak Count Frequency", conf, facet = "none", free_y = TRUE, verbose = TRUE, box = 800, min_body_length = 1000, upstream = NULL, downstream = NULL, ...)
devtools::install_github("MingLi-929/ChIPseeker")
library(TxDb.Hsapiens.UCSC.hg19.knownGene) txdb <- TxDb.Hsapiens.UCSC.hg19.knownGene
files <- getSampleFiles() peak <- files[[4]]
get the windows of promoter
promoter <- getPromoters(TxDb=txdb, upstream=3000, downstream=3000)
get the windows of genebody
genebody <- getGeneBody(TxDb = txdb, type = "gene")
get the windows of the start site of exon
exon <- getBioRegion(TxDb = txdb, downstream = 3000, upstream = 3000, by = "exon")
use plotAvgProf() to draw the TSS region
tagmatrix <- getTagMatrix(peak, weightCol = "V5", windows = promoter) plotAvgProf(tagmatrix, xlim = c(-3000,3000),conf = 0.95)
plotBioRegion can also draw the TSS region
the upstream and downstream parameter should set NULL(default)
promoter_matrix <- getBioRegionMatrix(peak, weightCol = "V5", windows = promoter, box=800, min_body_length = 1000)
plotting TSS region should input upstream and downstream parameter
when plotting TSS region, actual number of flank should be input
plotBioRegion(promoter_matrix,conf = 0.95, upstream = 3000, downstream = 3000)
can also plot the exon flank region
exon_matrix <- getBioRegionMatrix(peak, weightCol = "V5", windows = exon, box=800, min_body_length = 1000)
plotBioRegion(exon_matrix,conf = 0.95, upstream = 3000, downstream = 3000)
use plotAvgProf2 to draw the TSS region
plotAvgProf2(peak, TxDb=txdb, upstream=3000, downstream=3000, conf = 0.95)
plotBioRegion2 to draw the TSS region
if plotting the TSS region,
upstream and downstream parameter must be set
plotBioRegion2(peak, start_region_by = "gene", conf = 0.95, TxDb = txdb, upstream = 3000, downstream = 3000)
can also plot start site of 5UTR
plotBioRegion2(peak, start_region_by = "5UTR", conf = 0.95, TxDb = txdb, upstream = 3000, downstream = 3000)
use plotAvgProf2 to draw a list of the TSS region
plotAvgProf2(files,TxDb = txdb, upstream = 3000, downstream = 3000, conf = 0.95,facet = "row")
use plotBioRegion2 to draw a list of the TSS region
the type should be chosen as "promoters",
and the upstream and downstream parameter must be set
plotBioRegion2(files, start_region_by = "gene", conf = 0.95,facet = "row", TxDb = txdb, upstream = 3000, downstream = 3000)
use plotBioRegion to draw the genebody
genebodymatrix <- getBioRegionMatrix(peak,weightCol = "V5", windows = genebody)
the upstream and downstream parameters are NULL(default)
a plot with no flank extension will be drawn
plotBioRegion(genebodymatrix, conf=0.95)
genebody matrix can be extended by upstream and downstream
the parameter should be rel object or acutal length
genebodymatrix_extend <- getBioRegionMatrix(peak,weightCol = "V5", windows = genebody, upstream = rel(0.2), downstream = rel(0.2))
plotBioRegion(genebodymatrix_extend, upstream = rel(0.2), downstream = rel(0.2), conf = 0.95)
extend by absolute number
genebodymatrix_actual <- getBioRegionMatrix(peak,weightCol = "V5", windows = genebody, upstream = 1000, downstream = 1000)
plotBioRegion(genebodymatrix_actual, upstream = 1000, downstream = 1000, conf = 0.95)
use plotBioRegion2 to draw genebody automatically
plotBioRegion2(peak, body_type = "genes", conf = 0.95, TxDb = txdb, upstream = rel(0.2), downstream = rel(0.2))
draw a list of genebody with flank information
plotBioRegion2(files, body_type = "genes", conf = 0.95,facet = "row", TxDb = txdb, upstream = rel(0.2), downstream = rel(0.2))