 Zefau
commented
3 years ago
Zefau
commented
3 years ago Do you have some screenshots / pictures of the additional visual components you wish to be implemented ? I would like to get an idea of what you're wishing for.
Open mla4ger opened 3 years ago
Zefau
commented
3 years ago Do you have some screenshots / pictures of the additional visual components you wish to be implemented ? I would like to get an idea of what you're wishing for.
 mla4ger
commented
3 years ago
mla4ger
commented
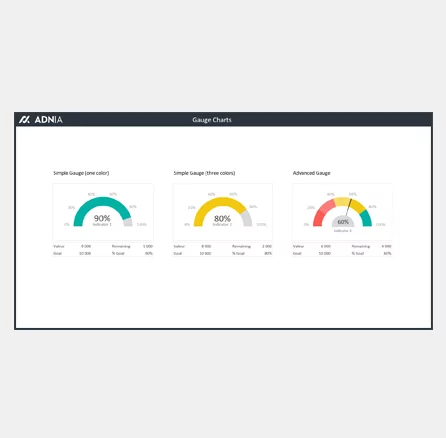
3 years ago something like this gauges: https://adniasolutions.com/wp-content/uploads/2019/01/Gauge-Chart-Excel-Template-Cover.png https://i.pinimg.com/originals/79/ef/6b/79ef6bec1417b79d7653fda267a069d3.png
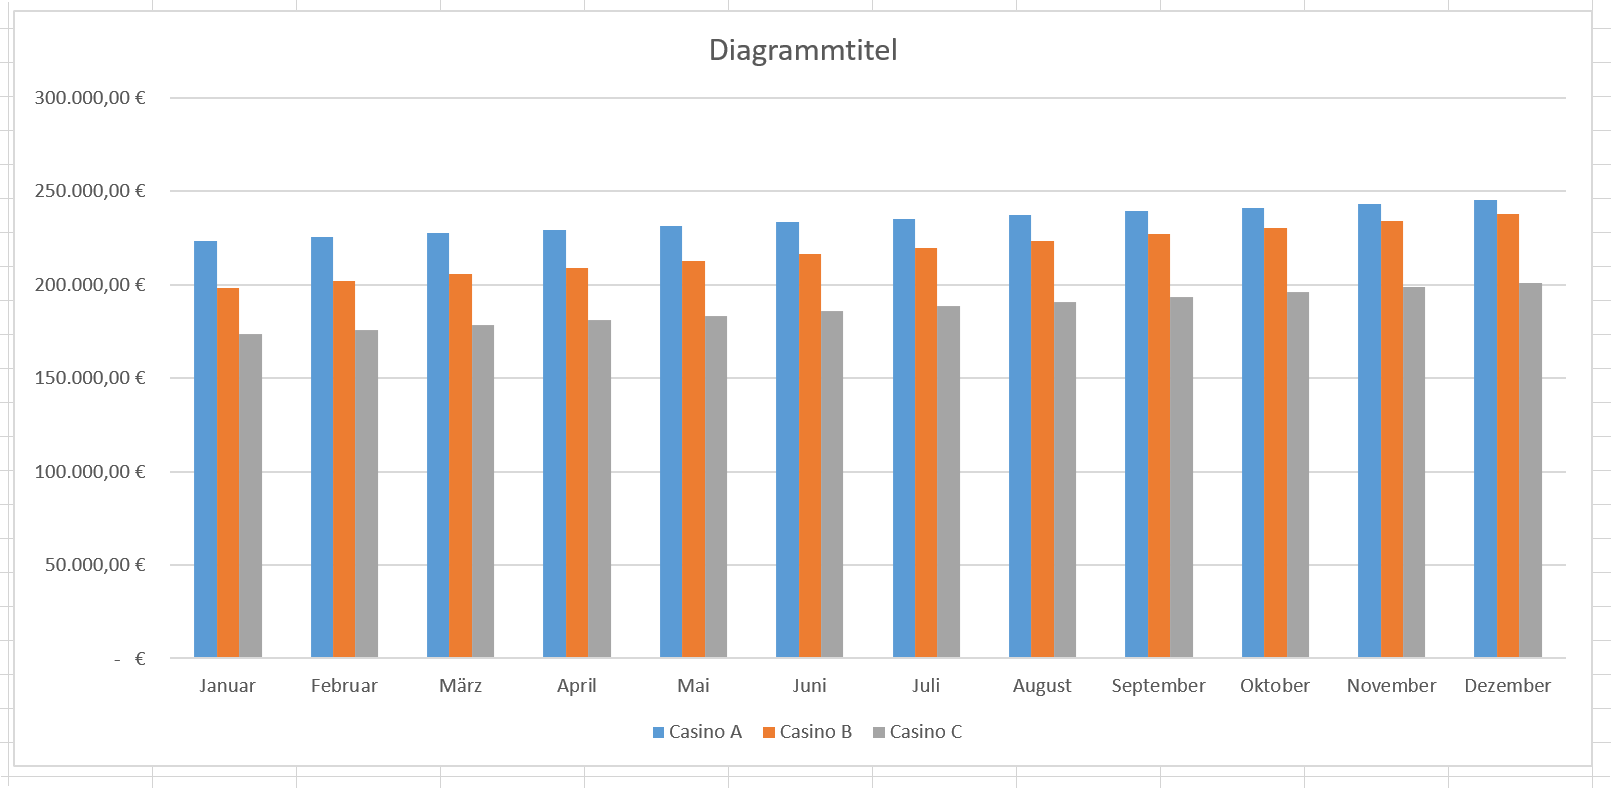
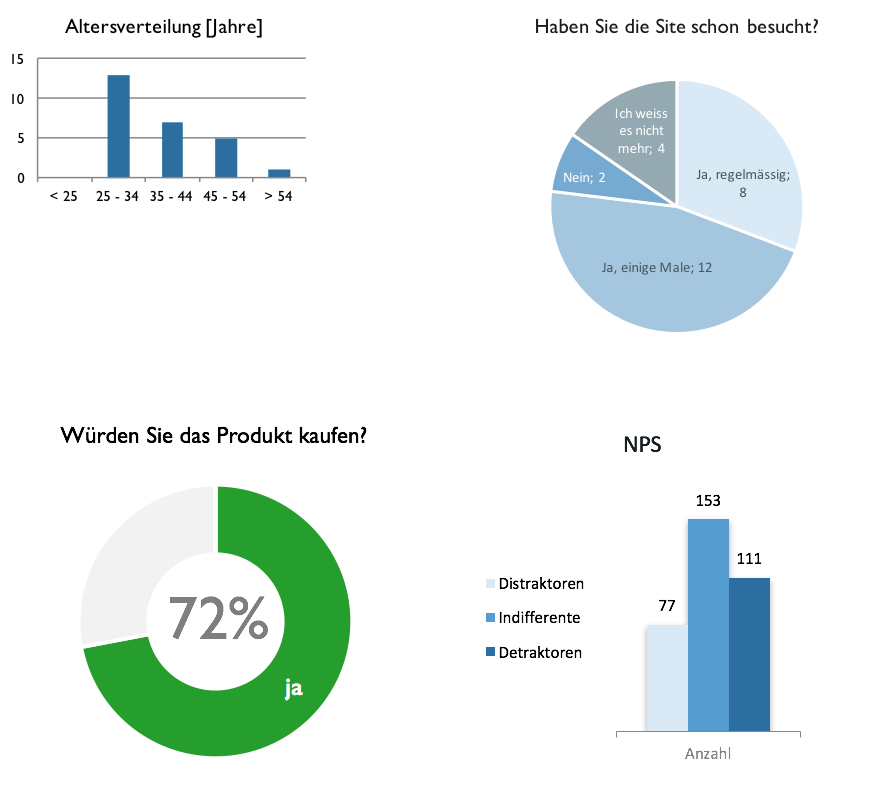
Bars: https://ms-office-training.de/wp-content/uploads/2018/08/4.Balkendiagramm.png https://www.usabilityblog.de/wp-content/uploads/2017/07/Diagramme-Beispiele.png
I hope it helps.
Zefau
commented
3 years ago Zefau
commented
3 years ago  flyinghuman
commented
2 years ago
flyinghuman
commented
2 years ago Hi, ich möchte das nochmal aufwärmen. Mit Apache ECharts sollte das ja jetzt in 3.x Problemlos integrierbar sein?
Was ich such sind Gauges
 und Horizontale Bar Charts aka Bar Race:

siehe auch https://echarts.apache.org/examples/en/index.html
wäre es möglich Gauges und die bereits vorhandenen Bar-Charts noch mit horizontalen zu erweitern? Dann bräuchte ich nicht extra ein Grafana :)
Danke!
It would be nice to have other grafic status like gauges, bar graphs or something like this.