 adriatic
commented
2 years ago
adriatic
commented
2 years ago Development Environment Setup
1. Setup Redwood Blog application (prepare the debugging target)
using the information from what's Next Redwood Tutorial section.
To explain the use of debugging tools in a debugging task, we need an application to be debugged. Reducing the application to a code snippet is not nearly as good approach, since the whole application's context plays a significant role.
Rather than creating such application from scratch, sufficiently complex to illustrate debugging practices, the well known application that was built in the course of the Redwood Tutorial will be used instead. This application (Redwood Blog) exists in this repository. Make a local clone and run it, using the commands defined in the section using the example repo of the Redwood Tutorial. Since the line the line yarn rw g secret is missing there, these commands are repeated here for your convenience.
git clone https://github.com/redwoodjs/redwood-tutorial.git
cd redwoodblog
yarn rw prisma migrate dev
yarn rw prisma db seed
yarn rw g secret
yarn rw dev
resulting with the front end of the Redwood Blog application running in the browser

Image 1 - Redwood Blog app running locally
2. Setup the DevTool debugger
using the article debugging with chrome
Having the Redwood Blog app running in the browser, invoke the DevTools from the browser menu with clicks 1, 2 and 3

Image 2 - invoking DevTools
Click on the menu item 3, the debugger will launch next to application running in the browser resulting with:

Image 3 - debugee and the debugger running together
The devtools docking (dock on the right in the above image) can be set according to the Image 4 (below)
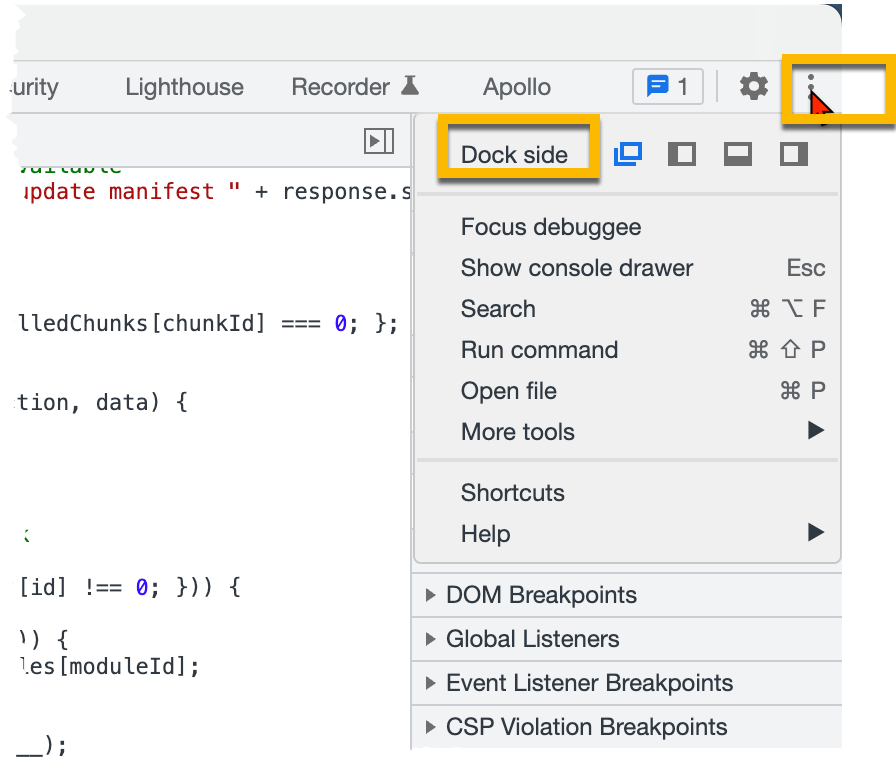
Image 4 - setting the devtools docking preference
Note: the browser panel with Redwood Blog is placed next to the devtools panel only as a convenience (so you can restart the application for example). Having just a single monitor, you can do everything on the devtools panel alone.
3. Setup Visual Studio Code debugger
assuming that the Visual Studio Code is already installed (if not, visit the Visual Studio Code home page and observe that the you will be prompted with the download button that preselects your development platform.
Download and install it, and then continue with the ???? paragraph)
... more to come here ...

Introduction
This first article explains the process of stepping through code using the debugger - not to chase a bug, but to get familiar with the debugger tool used to verify the correctness of a process flow.
Initially we will use the material from the Redwood Tutorial as the context, the cookbook articles are derived from. Limiting ourselves to this context is likely not sufficiently ambitious, but it will be a good start. Since authentication issues are famously fickle (quote from the authentication section of the Redwood Tutorial), we believe that presenting a detailed examination of the authentication process by stepping through the code using a debugger - either the Chrome debugger which is a part of DevTools, or VSCode debugger
The mechanics of using the either of two debuggers that will appear in this article will be presented later