 bijwaard
commented
3 years ago
bijwaard
commented
3 years ago Hi Arnaud,
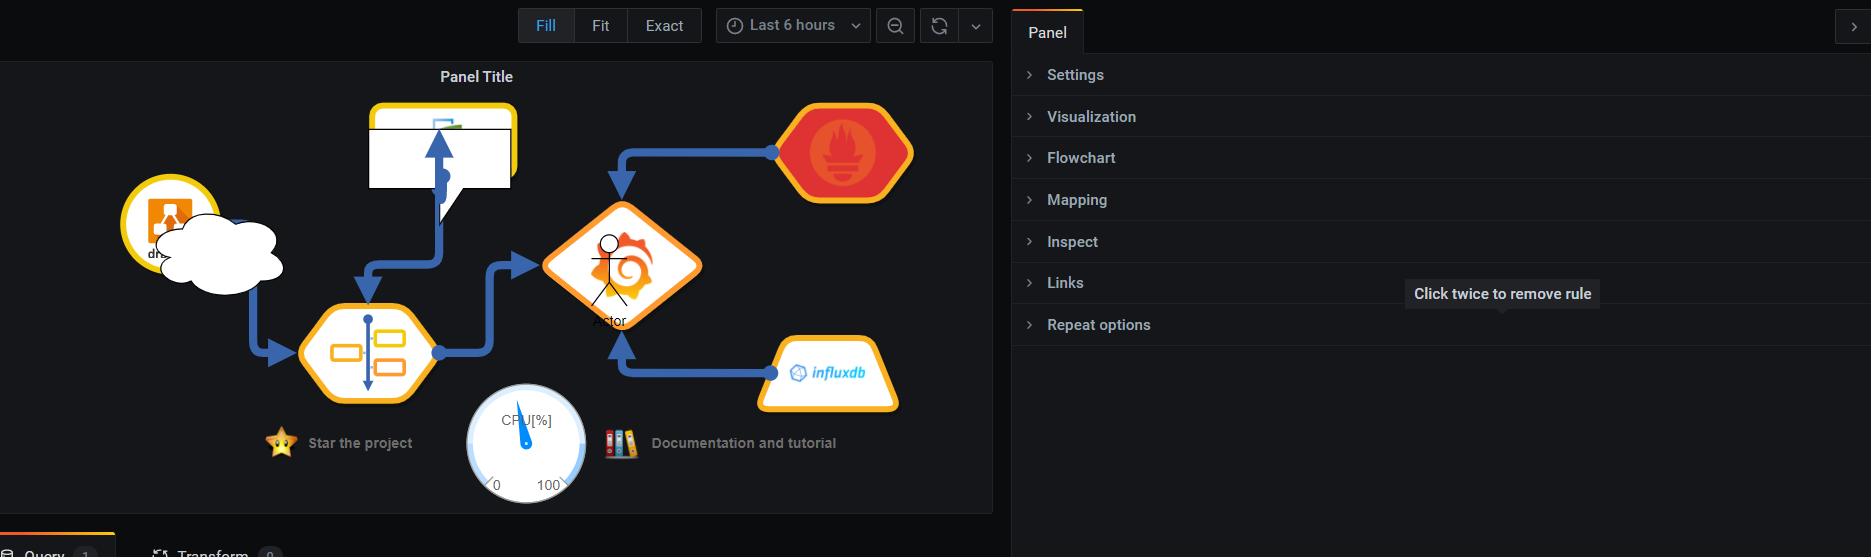
Great work! New edit design works fine, good to see some more shape detail in inspector. Curious what the Lvl column in the expector is for.
I found some minor issues in 0.9.1b snapshot (tried using firefox and chromium-browser in Linux with grafana 7.2.2):
- when editing the drawing, I still get warning about app.diagram.net
- as reported before in edit mode need to fit/fill/exact or enlarge diagram area to see diagram
Kind regards, Dennis
 algenty
 xkilian


 dennis


 cbtsgithub
 Schrolli91

 meshkov
 Data arrives correctly:

 I don't understand why all the rules work, A/Time disappears if I set it only for the first query.
whithout "Disable data aligment":
I don't understand why all the rules work, A/Time disappears if I set it only for the first query.
whithout "Disable data aligment":
 Environment:
Grafana v7.4.0
Zabbix data source
FlowCharting 1.0.0b
Environment:
Grafana v7.4.0
Zabbix data source
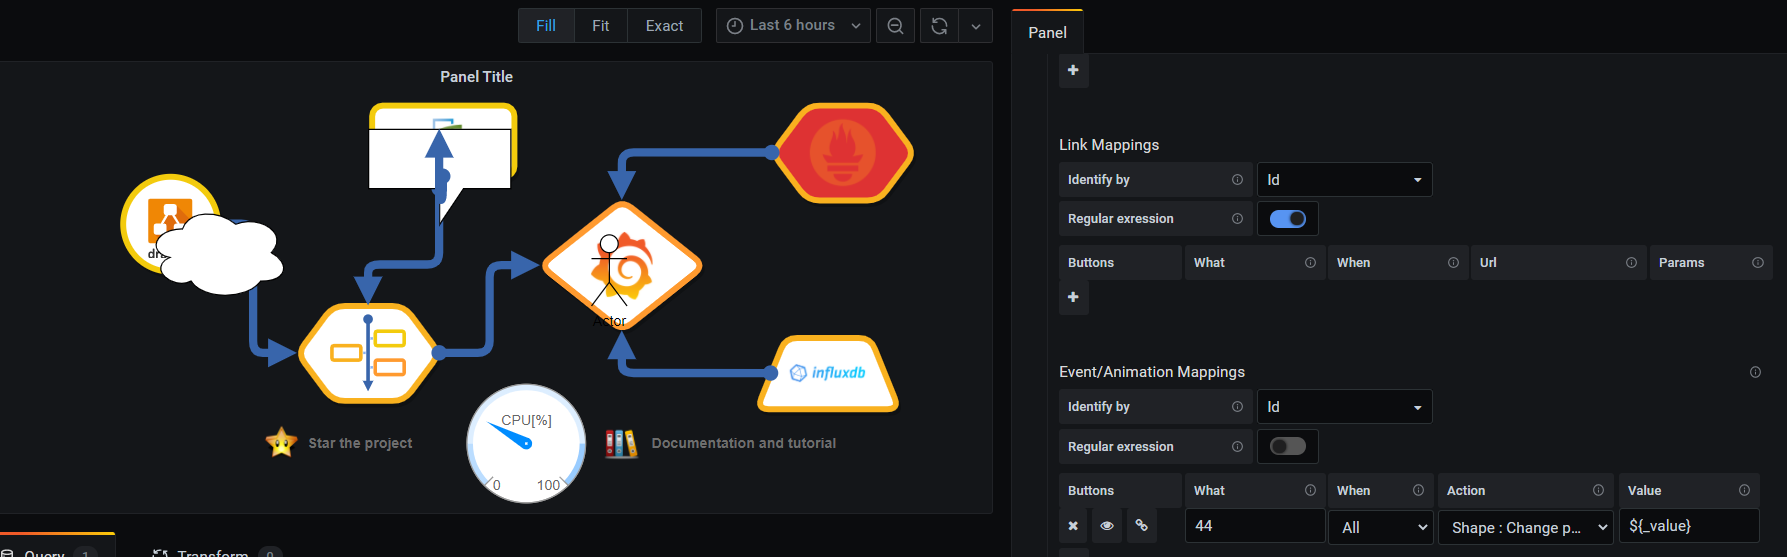
FlowCharting 1.0.0b Maybe 5-10 more caracters wide for the tooltip area so that longer text does not wrap.
Everything else is more of a feature wish list. Streaming, layers, sparkline graphs, bug fixes already raised by @bijwaard
Maybe 5-10 more caracters wide for the tooltip area so that longer text does not wrap.
Everything else is more of a feature wish list. Streaming, layers, sparkline graphs, bug fixes already raised by @bijwaard  Jii-Hoo
 kenizhou
 x70b1
x70b1 nmbath

 RedShift1
 neshorg
 raphaelrrl
 Teofaness
 isaqueprofeta
 cardosocristian
 iamelec
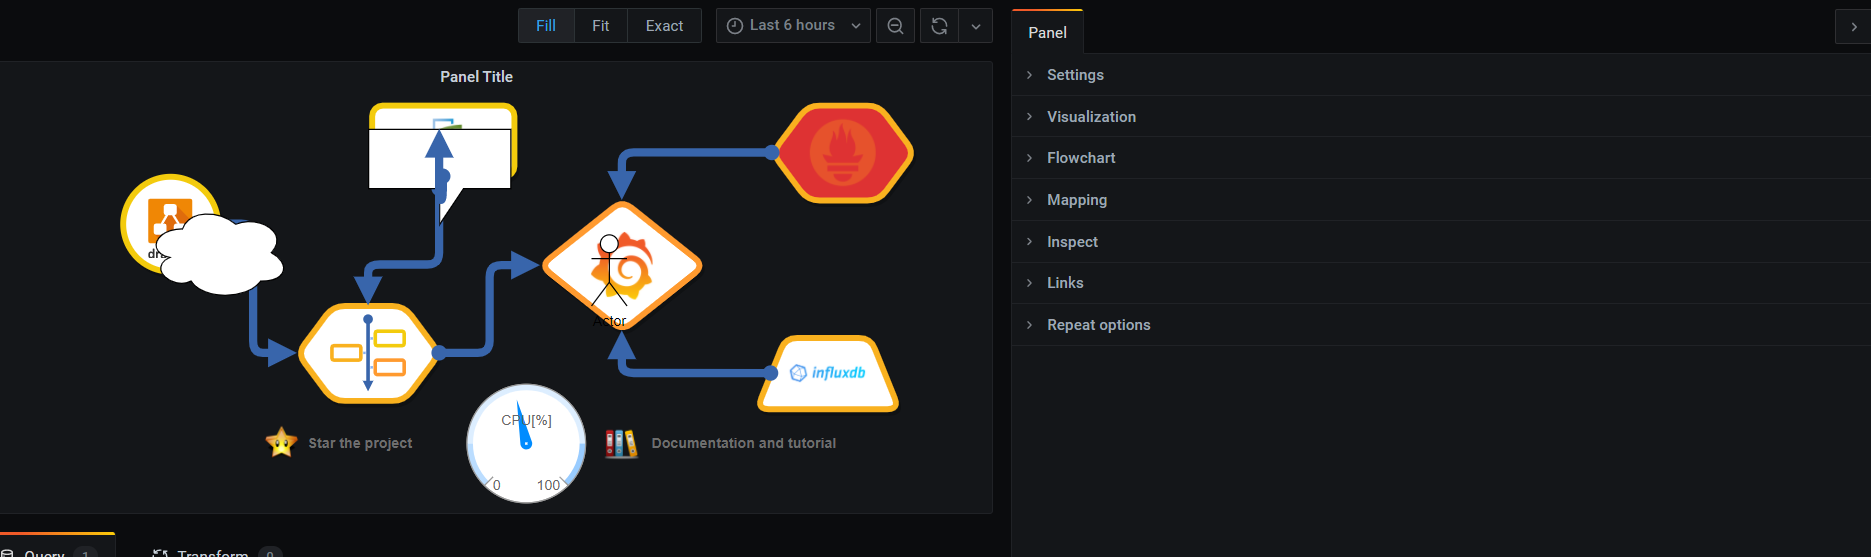
Hi dear users, I need your feedback for the next version of Flowcharting :
[0.9.1b SNAPSHOT] - 2020-11-08
Added
Fixed
Download it at https://algenty.github.io/flowcharting-repository/ARCHIVES.html
BR, Arnaud