alkaline-ml / pmdarima

A statistical library designed to fill the void in Python's time series analysis capabilities, including the equivalent of R's auto.arima function.
https://www.alkaline-ml.com/pmdarima
MIT License
1.57k stars 231 forks source link

auto_arima returns flat predictions for near-zero scaled time series #480

Open claudia-hm opened 2 years ago

claudia-hm commented 2 years ago

Describe the bug

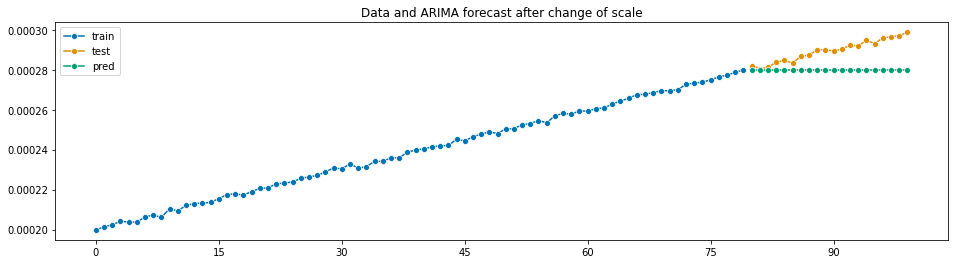
auto_arima is returning constant predictions when data is too small., i.e., close to zero

Initially, I generated a linear trendy time series with slope 0.5 and intercept 100, plus some noise. Then, I wanted to change units of my data and I divided the values of the time series by $10^6$. I expected to obtain a similar prediction. However, auto_arima returned a repeated constant value that poorly predicts my data.

To Reproduce

This is a sample code that shows the bug

import pmdarima as pm
from sktime.utils.plotting import plot_series
import pandas as pd
import numpy as np
import matplotlib.pyplot as plt 

#generate data
a, b = 0.5, 100
y1 = a*np.arange(0,100)+b
noise = np.random.normal(y1)
y1 = y1 + noise
y2 = y1 / (10**6)

window = 20
y1_train = pd.Series(y1[:-window], index = pd.Index(np.arange(0, len(y1)-window)))
y1_test = pd.Series(y1[-window:], index = pd.Index(np.arange(len(y1)-window, len(y1))))

y2_train = pd.Series(y2[:-window], index = pd.Index(np.arange(0, len(y2)-window)))
y2_test = pd.Series(y2[-window:], index = pd.Index(np.arange(len(y2)-window, len(y2))))

# Fit your model
model = pm.auto_arima(y1_train)

# make your forecasts
forecasts = model.predict(y1_test.shape[0])  # predict N steps into the future
y1_pred = pd.Series(forecasts, index=y1_test.index)
plot_series(y1_train, y1_test, y1_pred, labels=["train", "test", "pred"])
plt.title("Data and ARIMA forecast before change of scale")
plt.show()

# Fit your model
model = pm.auto_arima(y2_train)

# make your forecasts
forecasts = model.predict(y2_test.shape[0])  # predict N steps into the future
y2_pred = pd.Series(forecasts, index=y2_test.index)
plot_series(y2_train, y2_test, y2_pred, labels=["train", "test", "pred"])
plt.title("Data and ARIMA forecast after change of scale")
plt.show()

The output is: image image

Versions

/home/claudia/Desktop/debug_pmdarima/lib/python3.8/site-packages/_distutils_hack/__init__.py:30: UserWarning: Setuptools is replacing distutils.
  warnings.warn("Setuptools is replacing distutils.")

System:
    python: 3.8.10 (default, Nov 26 2021, 20:14:08)  [GCC 9.3.0]
executable: /home/claudia/Desktop/debug_pmdarima/bin/python3
   machine: Linux-5.13.0-1029-oem-x86_64-with-glibc2.29

Python dependencies:
        pip: 21.3.1
 setuptools: 60.5.0
    sklearn: 1.0.2
statsmodels: 0.13.2
      numpy: 1.21.5
      scipy: 1.8.0
     Cython: 0.29.28
     pandas: 1.4.1
     joblib: 1.1.0
   pmdarima: 1.8.4
Linux-5.13.0-1029-oem-x86_64-with-glibc2.29
Python 3.8.10 (default, Nov 26 2021, 20:14:08) 
[GCC 9.3.0]
pmdarima 1.8.4
NumPy 1.21.5
SciPy 1.8.0
Scikit-Learn 1.0.2
Statsmodels 0.13.2

Expected Behavior

I would expect to obtain a similar shape to the one produced in the first forecast

Actual Behavior

auto_arima produces the following forecast:

80    0.00028
81    0.00028
82    0.00028
83    0.00028
84    0.00028
85    0.00028
86    0.00028
87    0.00028
88    0.00028
89    0.00028
90    0.00028
91    0.00028
92    0.00028
93    0.00028
94    0.00028
95    0.00028
96    0.00028
97    0.00028
98    0.00028
99    0.00028
dtype: float64

Additional Context

If this is due to some numerical issue, I would like to understand what is happening and if there is some tolerance value that I can change to bypass this problem.

tgsmith61591 commented 2 years ago

Hi @claudia-hm sorry for the late reply. I'm looking into this. First thing I notice is a peculiar statsmodels warning when I enable the trace on the fit:

In [15]: model = pm.auto_arima(y2_train, trace=5)
Performing stepwise search to minimize aic
/opt/miniconda3/envs/ml/lib/python3.7/site-packages/statsmodels/tsa/statespace/sarimax.py:1890: RuntimeWarning: divide by zero encountered in reciprocal
  return np.roots(self.polynomial_reduced_ar)**-1
 ARIMA(2,1,2)(0,0,0)[0] intercept   : AIC=-1614.762, Time=0.07 sec
First viable model found (-1614.762)
 ARIMA(0,1,0)(0,0,0)[0] intercept   : AIC=-1670.667, Time=0.06 sec
New best model found (-1670.667 < -1614.762)
 ARIMA(1,1,0)(0,0,0)[0] intercept   : AIC=-1665.984, Time=0.03 sec
 ARIMA(0,1,1)(0,0,0)[0] intercept   : AIC=15212.220, Time=0.05 sec
 ARIMA(0,1,0)(0,0,0)[0]             : AIC=-1839.861, Time=0.02 sec
New best model found (-1839.861 < -1670.667)
 ARIMA(1,1,1)(0,0,0)[0] intercept   : AIC=-1663.997, Time=0.04 sec

Best model:  ARIMA(0,1,0)(0,0,0)[0]
Total fit time: 0.276 seconds

I'll dig more into this.

fkiraly commented 1 year ago

is there an update, @tgsmith61591 ?

tgsmith61591 commented 1 year ago

Looks like it still presents even with the latest statsmodels (0.14.0) when using the default optimizer ('lbfgs'):

  File "statsmodels/tsa/statespace/_representation.pyx", line 1373, in statsmodels.tsa.statespace._representation.dStatespace.initialize
  File "statsmodels/tsa/statespace/_representation.pyx", line 1362, in statsmodels.tsa.statespace._representation.dStatespace.initialize
  File "statsmodels/tsa/statespace/_initialization.pyx", line 288, in statsmodels.tsa.statespace._initialization.dInitialization.initialize
  File "statsmodels/tsa/statespace/_initialization.pyx", line 406, in statsmodels.tsa.statespace._initialization.dInitialization.initialize_stationary_stationary_cov
  File "statsmodels/tsa/statespace/_tools.pyx", line 1525, in statsmodels.tsa.statespace._tools._dsolve_discrete_lyapunov
numpy.linalg.LinAlgError: LU decomposition error.

Seems like changing the optimizer method makes a difference:

In [23]: model = pm.auto_arima(y2_train, method='nm')

In [24]: forecasts = model.predict(y2_test.shape[0])

In [25]: forecasts
Out[25]:
80    0.000280
81    0.000281
82    0.000281
83    0.000282
84    0.000283
85    0.000284
86    0.000285
87    0.000286
88    0.000287
89    0.000288
90    0.000289
91    0.000290
92    0.000291
93    0.000292
94    0.000293
95    0.000294
96    0.000295
97    0.000296
98    0.000297
99    0.000298
dtype: float64

I tried the following and they also appeared to work without issue: