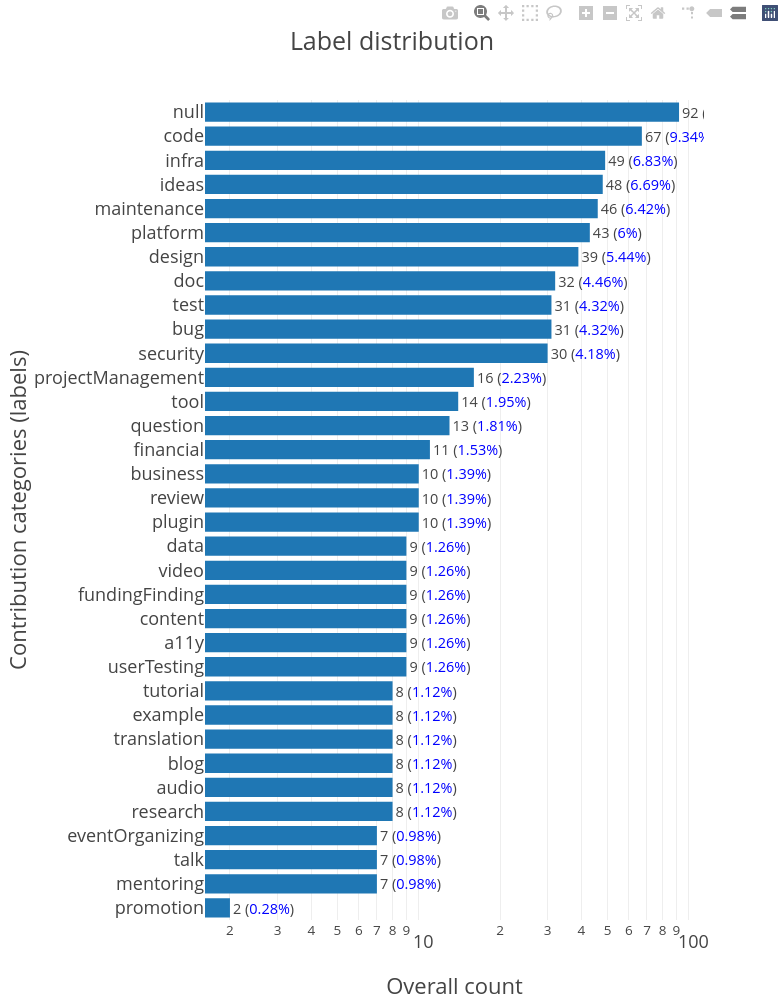
Note: the diagram shown above was updated and now we're up to 613 labels (~15.01% of which are in the null category).
If you have any labels that would help in levelling up the actual categories then it would be grand.
What I'm hoping to achieve right here is to have each category represent at least 9.58% and ideally having a more levelled-up distribution of ~19.15% each (while trying to have labels that are realistic or better: used in some repos).
At the moment, the dataset looks like: This is not good! and that's what we have after a down-sampling on the
nulllabels (i.e. labels that can't be classified in one of the categories in https://allcontributors.org/docs/en/emoji-key) which are ≈ 16.61% of the whole dataset (ideally being less thanbusiness, ...,userTestingcombined). Down-samplingnulllabels would be an option, however, most of the ones left seems (fairly) widely used.So the remaining option is to level up the other categories by adding more labels of those categories, especially the ones that can be found in GH/GL/Bitbucket repos alone.