anntzer / mplcursors

Interactive data selection cursors for Matplotlib.
https://mplcursors.readthedocs.io
zlib License
114 stars 20 forks source link

How can I make line2D only pickable at valid data point #51

Open 665465 opened 2 years ago

665465 commented 2 years ago

Line2d is interpolated when using linestyle '-'. But I don't want these interpolated point to be pickable. Or is there any method that I can make the annotation pointing to the valid data point in cursor 'ADD' event? image
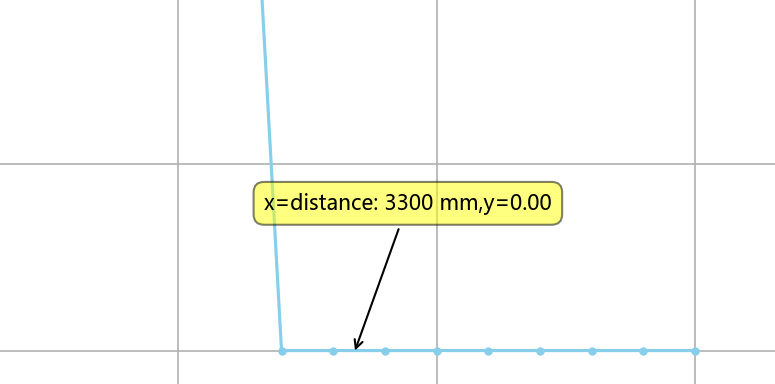
Currently I'm working around this by plotting another line using linestyle with marker such as 'o', and creating a cursor on it.

line1 = axes[1].plot(x , y , label='_nolegend_')
line2 = axes[1].plot(x , y , 'o',label=label)
mplcursors.cursor(line2) 

Still I want to know is there a better way to do it.

Thanks.

anntzer commented 2 years ago

No, this is the way to do it. You can consider making the dots transparent with c="none", though.

A good improvement would be to add a method to "programmatically add a selection at a given index", which would allow you to achieve what you want by hooking the "add" event, though.

665465 commented 2 years ago

No, this is the way to do it. You can consider making the dots transparent with c="none", though.

A good improvement would be to add a method to "programmatically add a selection at a given index", which would allow you to achieve what you want by hooking the "add" event, though.

I've tried to do that and have read the docs. But I can't find an example about adding a selection manually. Could you give me some hints ?

anntzer commented 2 years ago

That's not possible right now, the point is that this would require quite a bit of work to enable (not necessarily very hard, just stuff that needs to be done...).

665465 commented 2 years ago

Looking forward to see the update.😁

pragma- commented 2 days ago

I too would prefer the annotation to "snap" to the nearest valid points on the line. Please add this ability.

pragma- commented 2 days ago

I have found a snippet that does exactly what I need, from https://stackoverflow.com/a/47166787. Hope this helps anybody reading this thread, and also helps this functionality to get into mplcursors soon.

import matplotlib.pyplot as plt
import numpy as np; np.random.seed(1)

x = np.sort(np.random.rand(15))
y = np.sort(np.random.rand(15))
names = np.array(list("ABCDEFGHIJKLMNO"))

norm = plt.Normalize(1,4)
cmap = plt.cm.RdYlGn

fig,ax = plt.subplots()
line, = plt.plot(x,y, marker="o")

annot = ax.annotate("", xy=(0,0), xytext=(-20,20),textcoords="offset points",
                    bbox=dict(boxstyle="round", fc="w"),
                    arrowprops=dict(arrowstyle="->"))
annot.set_visible(False)

def update_annot(ind):
    x,y = line.get_data()
    annot.xy = (x[ind["ind"][0]], y[ind["ind"][0]])
    text = "{}, {}".format(" ".join(list(map(str,ind["ind"]))), 
                           " ".join([names[n] for n in ind["ind"]]))
    annot.set_text(text)
    annot.get_bbox_patch().set_alpha(0.4)

def hover(event):
    vis = annot.get_visible()
    if event.inaxes == ax:
        cont, ind = line.contains(event)
        if cont:
            update_annot(ind)
            annot.set_visible(True)
            fig.canvas.draw_idle()
        else:
            if vis:
                annot.set_visible(False)
                fig.canvas.draw_idle()

fig.canvas.mpl_connect("motion_notify_event", hover)

plt.show()
pragma- commented 2 days ago

I've updated the previous code to work with multiple lines:

import matplotlib.pyplot as plt
import numpy as np

np.random.seed(1)
y = np.random.rand(4, 15)
x = [np.arange(15) for i in range(len(y))]
fig, ax = plt.subplots()
lines = []
for i in range(4):
    l, = ax.plot(x[i], y[i], '-o', label=f'Line {i+1}')
    lines.append(l)

ax.legend()

annot = ax.annotate("", xy=(0, 0), xytext=(20, 20), textcoords="offset points",
                    bbox=dict(boxstyle="round", fc="w"),
                    arrowprops=dict(arrowstyle="->"))
annot.set_visible(False)

def update_annot(line, idx):
    x, y = [line.get_xdata()[idx], line.get_ydata()[idx]]
    annot.xy = (x, y)
    text = f'{line.get_label()}\n{y:.2f}'
    annot.set_text(text)
    annot.get_bbox_patch().set_alpha(0.4)

def hover(event):
    vis = annot.get_visible()
    if event.inaxes == ax:
        for line in lines:
            cont, ind = line.contains(event)
            if cont:
                update_annot(line, ind['ind'][0])
                annot.set_visible(True)
                fig.canvas.draw_idle()
                break
            else:
                if vis:
                    annot.set_visible(False)
                    fig.canvas.draw_idle()

fig.canvas.mpl_connect("motion_notify_event", hover)
plt.show()