 echarts-bot[bot]
commented
3 years ago
echarts-bot[bot]
commented
3 years ago Hi! We've received your issue and please be patient to get responded. 🎉 The average response time is expected to be within one day for weekdays.
In the meanwhile, please make sure that you have posted enough image to demo your request. You may also check out the API and chart option to get the answer.
If you don't get helped for a long time (over a week) or have an urgent question to ask, you may also send an email to dev@echarts.apache.org. Please attach the issue link if it's a technical question.
If you are interested in the project, you may also subscribe our mailing list.
Have a nice day! 🍵
 github-actions[bot]
What problem does this feature solve?
To cite the Open Geospatial Consortium (OGC ), https://www.ogc.org/: “Geological and geophysical data are crucial for many domains of our society. Any domain that need to probe the underground relies on these data: raw material exploration, hydrology, oil and gas, mining, civil engineering (constructions, transportation), and environmental sciences. In most cases, the according human activities that need to investigate the underground are relying on indirect observations methods like geophysical measurements (e.g., seismic or geoelectrical exploration). However, for direct investigations of the subsurface and for the verification of indirect measurements and models, drilling is essential. Notwithstanding, each geoscientific domain has its own set of methods and interest (resource geologists look at rock properties relevant to mineral occurrences; hydrogeologists at water resources; civil engineers at mechanical properties; and the energy sector at fossil fuel potential) they all use the same basic engineering feature, a borehole" ... However, Open-Source-Tools for Borehole or Well Log Visualisation that implement even a minimal set of features are currently not available. Most tools are commercial and therefore not suitable for their utilisation in Research Infrastructures, which is the most important Use Case. Scientist, for example, use previews to evaluate data regarding their suitability for data mining and fusion. Also the appllication of simple statistical methods to the data and the subsequent evaluation is often required.
What does the proposed API look like?
An image is worth a thousands rows of code: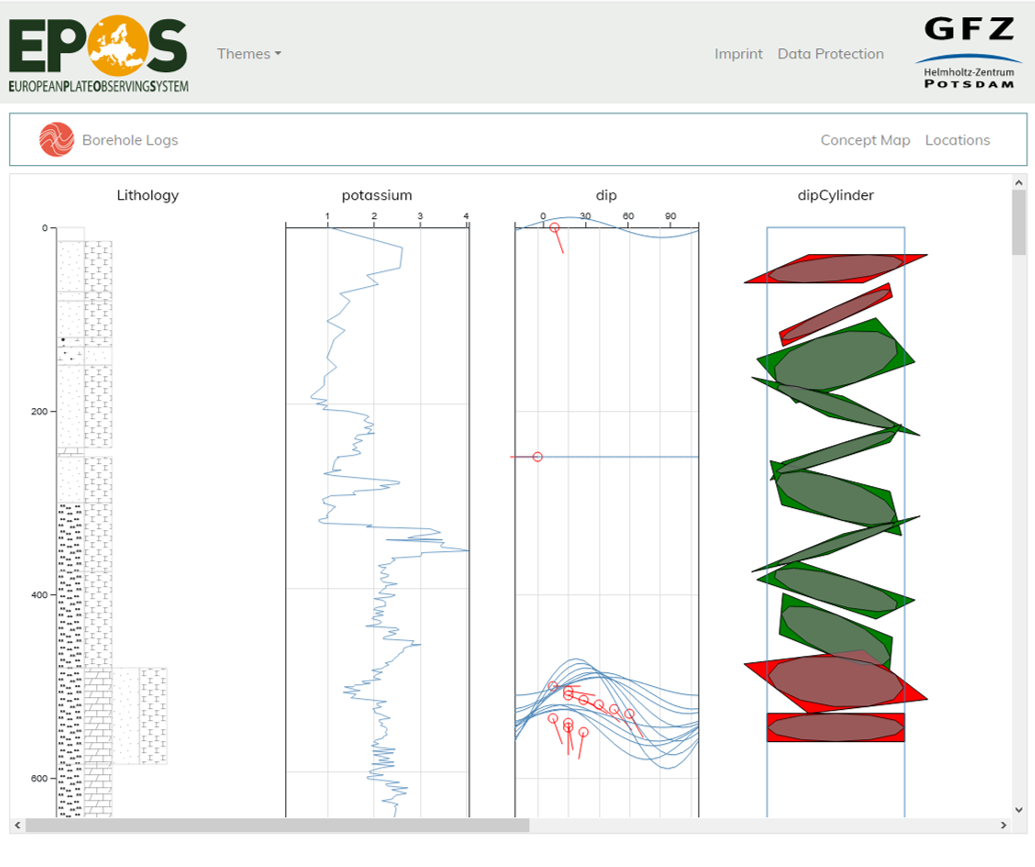 The image above is a screenshot of a not yet available web-application and implemented based on d3.js