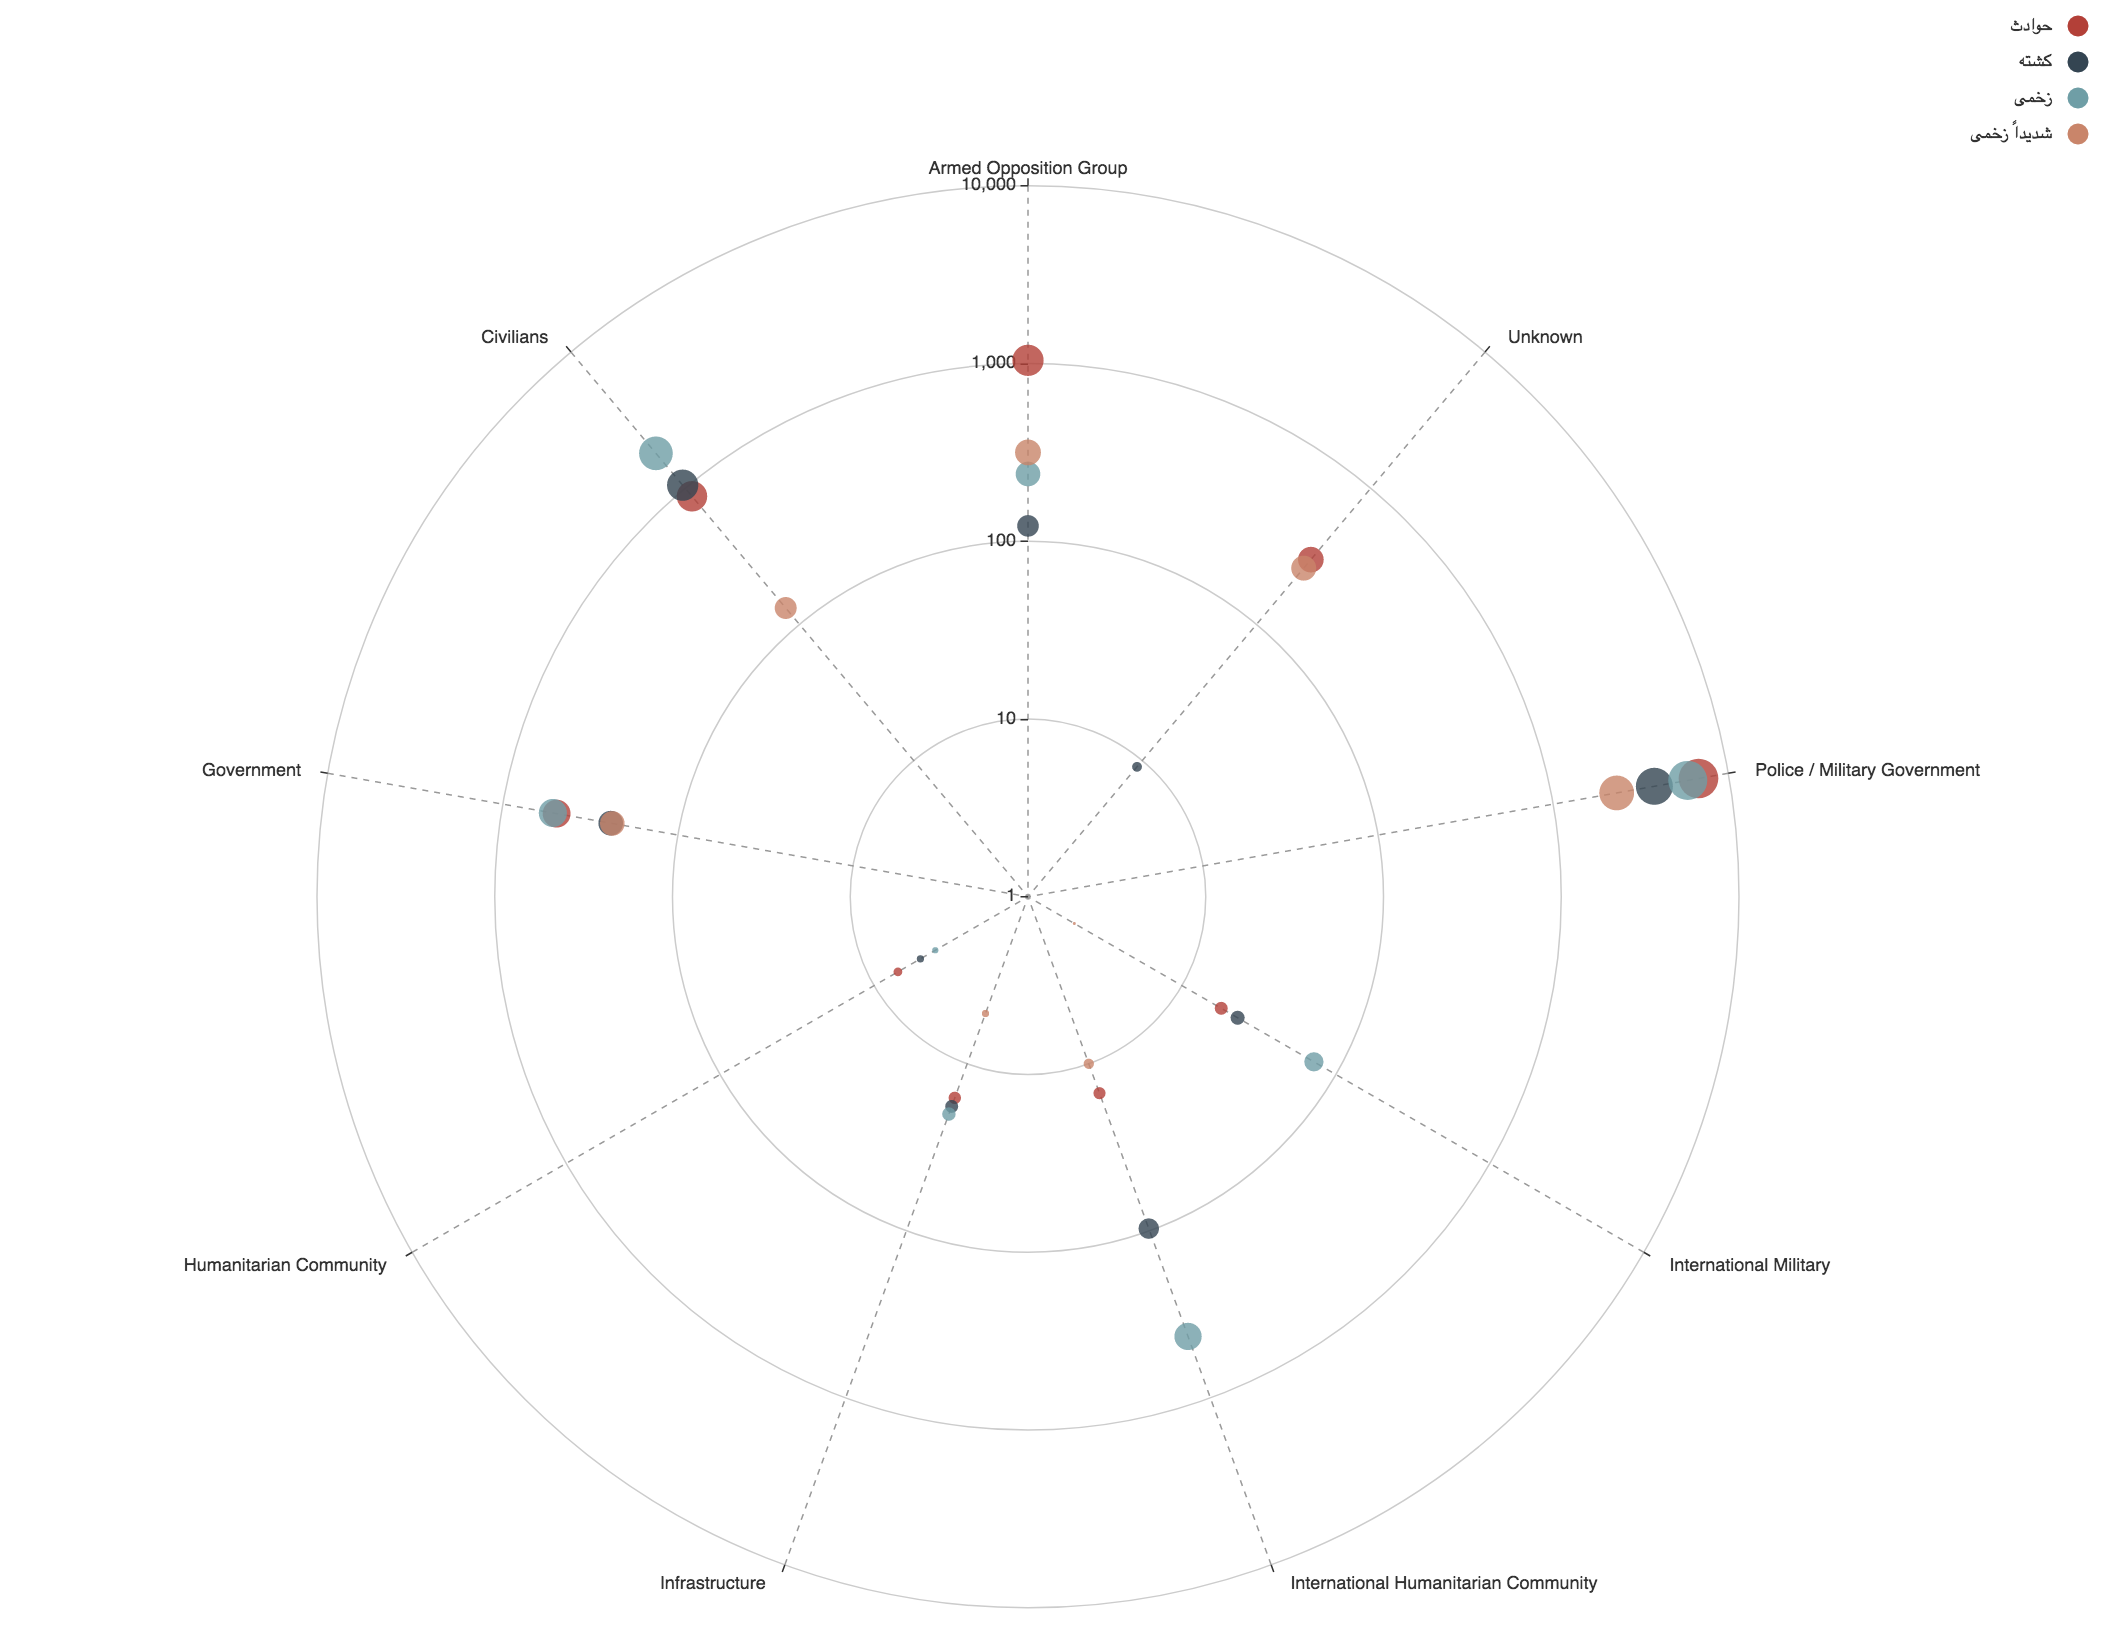
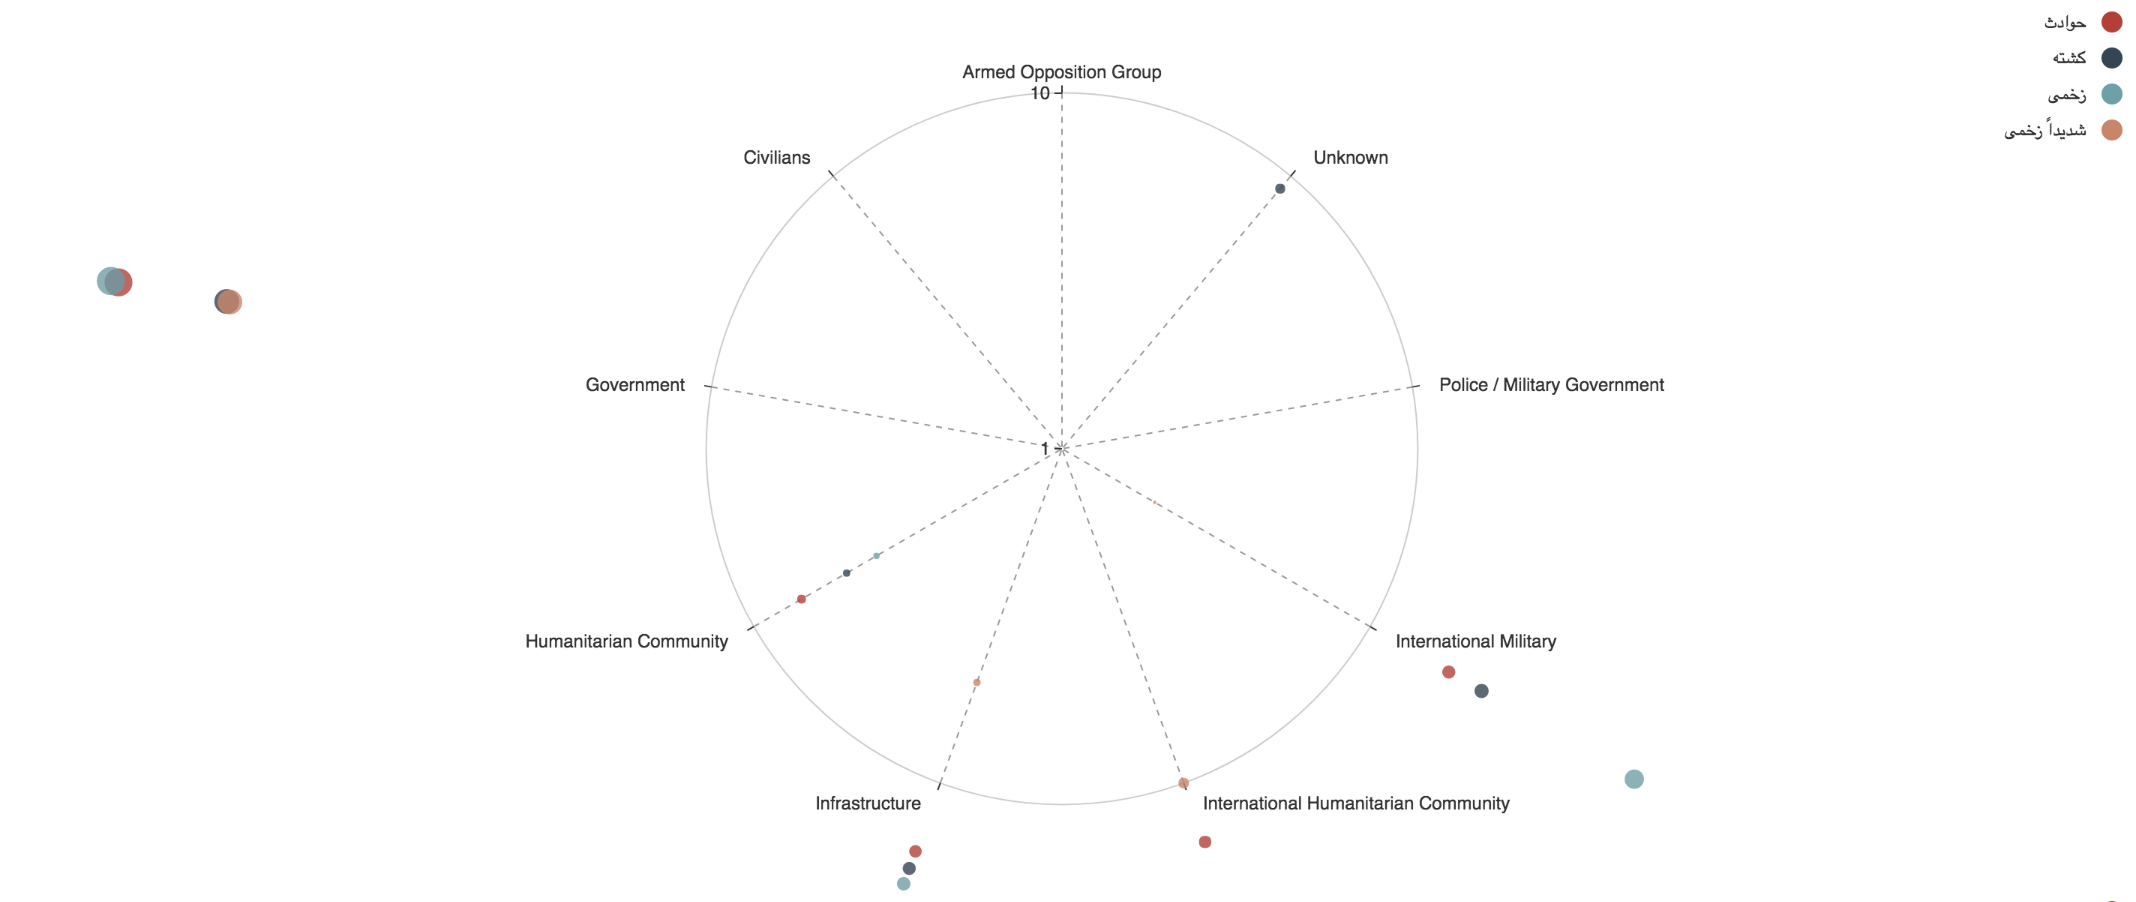
Ah, one more thing - animation of lines symbol only happens in canvas:

Closed jarben closed 2 years ago
Ah, one more thing - animation of lines symbol only happens in canvas:

@jarben Thanks Jarben! It's very nice of you to provide this info for us. After a general look of the cases, I think many of the bugs have been fixed since 3.8.5, like the gradient problem. I will check it and fix the other bugs. Thanks again!
That's great to hear @Ovilia , looking forward to test 3.8.6+, pls let me know if you need more info or code samples. thanks, Jaro
Hi @jarben , here's some updates on the bugs reported above. Please help have a look, and thanks for your contribution again! 😃
To test with the newest code (which is not released yet), you need to update zrender and echarts repo, and run npm install and node build/build.js for zrender and then echarts. You may find an example of test file with test/svg.html.
Fixed: Problem 1: This bug is due to render order of fill and stroke. Fixed in https://github.com/ecomfe/zrender/commit/7741d698b43b5216d851de4c3a7152312d2e090d . Problem 2: I'm not sure if this is fixed by https://github.com/ecomfe/zrender/commit/01b955f31aee95c9347d83cccce6ac62926aa16f, please help test out. Problem 3 and 7: Gradient problems were fixed.
More information needed: Problem 4 and 5: Could you provide the code to reproduce these problems?
Not supported: Problem 6: Heatmap is created using Canvas blending, so it is not supported by SVG until we have other plans.
Hi @Ovilia, thanks for your update! I'll do some testing & provide code samples asap, is there any deadline for 3.8.6? Thanks!!!
@jarben Actually, we are about to release 4.0 beta! 😄 If feedback can be given before 12th Jan, it's more likely to be fixed in this version. But don't be worried if you are too busy to test them, we can always fix it in future versions.
That's a great news! Will try to allocate some time asap:)
I have managed to get some time for testing, here are results: 1.-4. Can't reproduce anymore, great!
Also found couple of minor differences: I. Bar labels disappear after animation finishes, rather than before it finishes (canvas)
Click on Male legend to disable this category, Male labels in the bar chart disappear differently than in cavas:

II. Mark point label is not centered as in canvas:

Also found some issues in the latest build, not sure whether this is a good place to post them as it's not SVG related and potentially known issues. Anyway, here it is:
A) Shifting legend colors in PIE charts:
Click on item 1 in the pie chart = item 7 changes color
 pie-legend-colors.zip
B) Bar chart changes color when using data zoom (items outside of original start/end get default color rather than item's color)
 Example:
histogram-item-color.zip
C) Sankey shows an error in console:
 Example:
sankey.zip
D) Heatmap and punch cards don't show up:
 Examples:
heat-map.zip
punch-card.zip
E) Pie timeline shows an error after clicking on timeline:
 pie-timeline.zip
Looking forward for the realease, sunburst is looking great!!
@jarben Thanks for that!!! I'll follow up and test them. :)
Brilliant, thanks @Ovilia !
@Ovilia I also find the issue about Heatmaps in 3.8.5 by SVG renderer.
I see ECharts 4.0 will be released on 12th Jan from the ECharts weibo.
will fix this issue in 4.0 version?
@palmerye Hi, ECharts 4.0 will be release in 16th Jan. The implement method of Heatmap is strongly related to Canvas, which we currently cannot find a way to replace with SVG. So I'm afraid it will not be available in 4.0.
Note that this kind of heatmap is supported for SVG, but not those with blending effect.
Thanks @Ovilia !
Hello, I am currently using echarts for showing graphs on my web. I wanted to try echarts ver 4.04 to render the graphs in svg but I keep getting this error message.

It's happened when I wanted to show text label in every single bar (on the right) like this one :

Hope it can be fixed. Thank you.
Hei I got this in my notebook too. But after I restarted jupyter and reran the notebook, the warnings are gone. So I was not able to reproduce it later.
@chfw really? but in my case, I still cannot get rid of it... I have tried to produce other bar graph type and when I show the label on it, it still shows the error.
btw, other bugs I've spotted :
I wanted to produce a stacked bar chart like this one :

but, when I change the type of yAxis to 'log', it cannot produce the graphs and shows error :


and of course, when I try to put the label inside of every single bar it still shows the error I mention above. Thank you for hearing me out.
Hi! I wanted to report another bug I've found.
I have a graph like below. Everything works perfectly when I used 'canvas' renderer.

and this one is a screenshot when I use the magicType tools.

But when I use 'svg' renderer, I cannot change the bar graph into line graph and shows error like picture below.


and I also notice that when I hover to the magicType tools, the 'title' text that should have appear below the icon goes to the edge on the top left of the graph.

Hope it can be fixed soon because I really love this chart. Thank you and keep up the good work!
@rafinkanisa Can you provide the code to reproduce it? Since I cannot reproduce it from a random chart.
@Ovilia Sure! Here are the codes. I put 3 files corresponding with the error I mention above.
@rafinkanisa I fixed this problem in https://github.com/ecomfe/zrender/commit/be3fb89d6079f216d0779adf8378534ba715d175 . Please wait for the next release, or you may build echarts by yourself.
To build:
npm inode build/build.js --releaseFull tutorial: https://ecomfe.github.io/echarts-doc/public/en/tutorial.html#Create%20Custom%20Build%20of%20ECharts
@Ovilia Wow. Thank you...
Hi @Ovilia ! I've found another issue...
In my project I used 'canvas' renderer to create a graph on RTL mode and it's work fine like this :


But, when I used 'svg' renderer, it becomes like this :


Here, I put the codes to generate those graphs. errorRTL.html.zip
And also, I've created a graph like below using echarts ver 3.8.5 in RTL mode using canvas renderer

But, when I changed it to svg and using echarts ver 4.0.4, it becomes like this one.

even when I tried to use canvas renderer in this version, the graph didn't rendered as beautiful as the older version. It becomes like this

the error log that I got :

Here is the code to produce the polar chart. errorPolar.html.zip
Is this issue also part of the issue I mention before? Thank you...
hello @Ovilia , I'm using echart and I want to getSVG of charts to draw pdf without rendering svg in a web view , is there any function for that ? because these a problem in bar charts after rendering it into web view and send the DOM elements to draw the pdf, it draws with no bars

Any news about rendering / export as svg ?
SVG rendering should work almost the same as canvas by now. I'm going to close this issue. For new bugs report, please open new issues.
Version: 3.8.5
I've managed to get some time and try the SVG renderer beta. Apart from some issues it works really well!
Below is a list of uses cases, pls let me know if you need to provide sample code to some of the cases:
(left = canvas, right = svg)
borderWidth on itemStyle doesn't seem to be applied (seems to always use 1px):
Pie chart shows selected pieces on load, hovering over it reveals them:
Gradient doesn't seem to work as in canvas:
In some cases lines or areas are cut off. The issue is that this doesn't happen always so reproducing it is tricky:
In some cases maps get this black background (not all maps):
Heatmaps shows as below (+ visual map legend gets incorrect gradient)
Gauge with gradient issue:
I'm happy to send example codes, just tell me which cases are not known issues (since its beta) and I can make them. It would be also great if the playground app allows to use SVG renderer so I can test the code in the same environment.
Again, this is amazing feature so thanks for your hard work!