 asfimport
commented
4 years ago
asfimport
commented
4 years ago @pmouawad (migrated from Bugzilla): Hello, Can you provide jmeter.log file ? Thank you
Open asfimport opened 4 years ago
asfimport
commented
4 years ago @pmouawad (migrated from Bugzilla): Hello, Can you provide jmeter.log file ? Thank you
asfimport
commented
4 years ago Saurabh Barthwal (migrated from Bugzilla): JMETER-LOG FILE
Created attachment jmeter (3).log: JMETER-LOG FILE
asfimport
commented
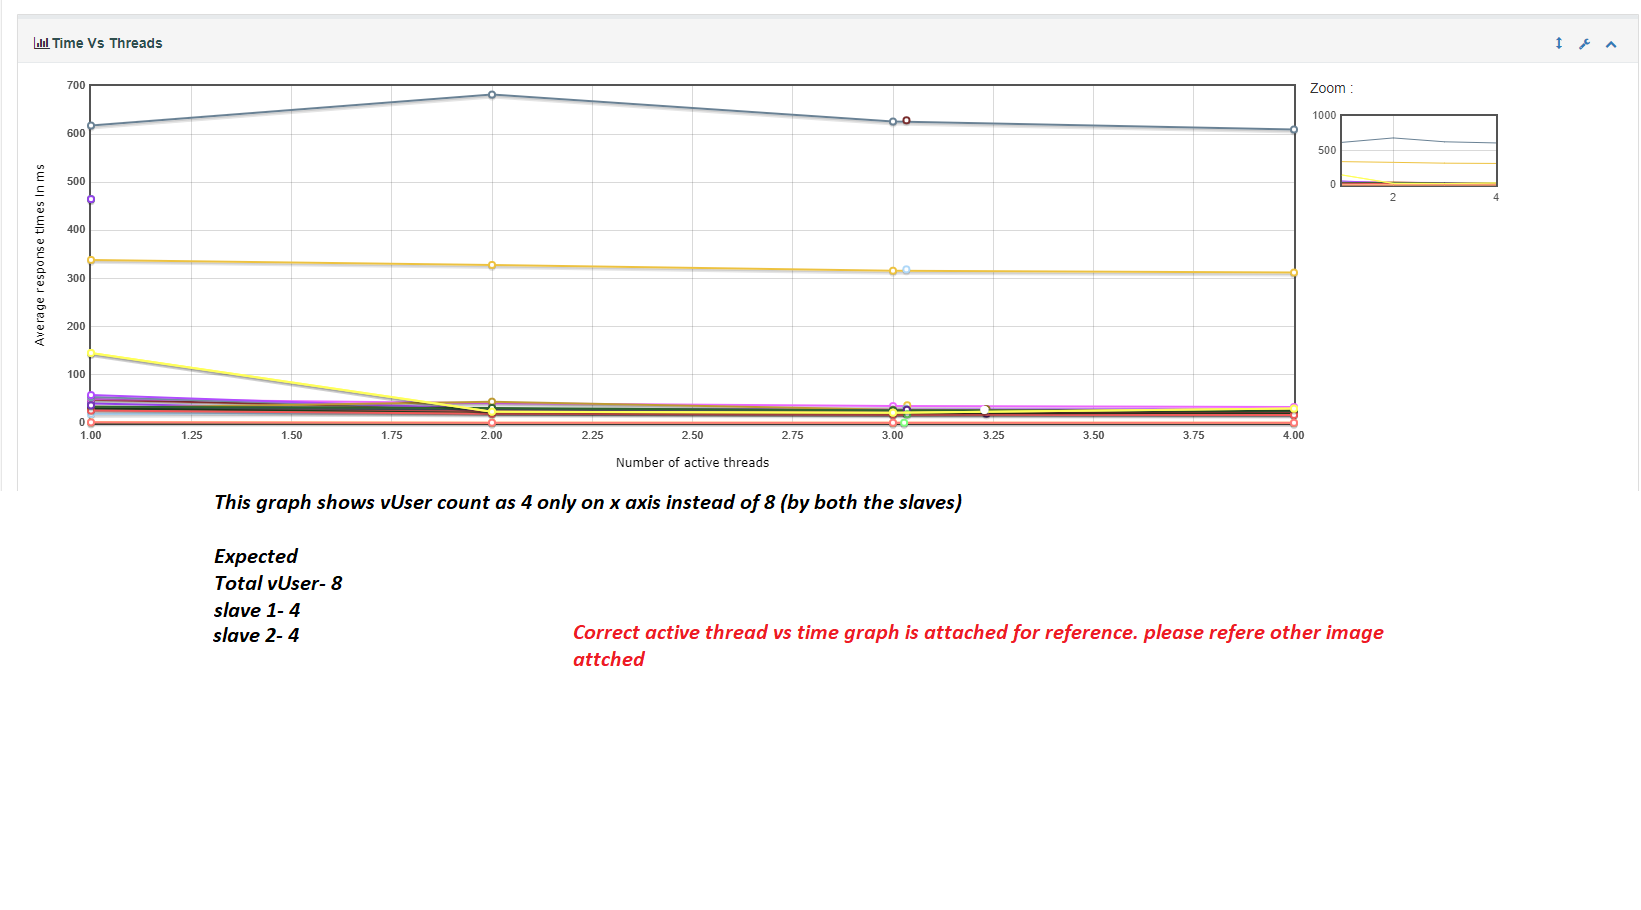
4 years ago Saurabh Barthwal (migrated from Bugzilla): Response time vs thread graph which shows wrong thread count on x axis. test details are mentioned in the attached file
Created attachment Wrong-response_time_vs_Active_threads_graph.png: Response time vs thread graph which shows wrong thread count on x axis
 asfimport
commented
4 years ago
asfimport
commented
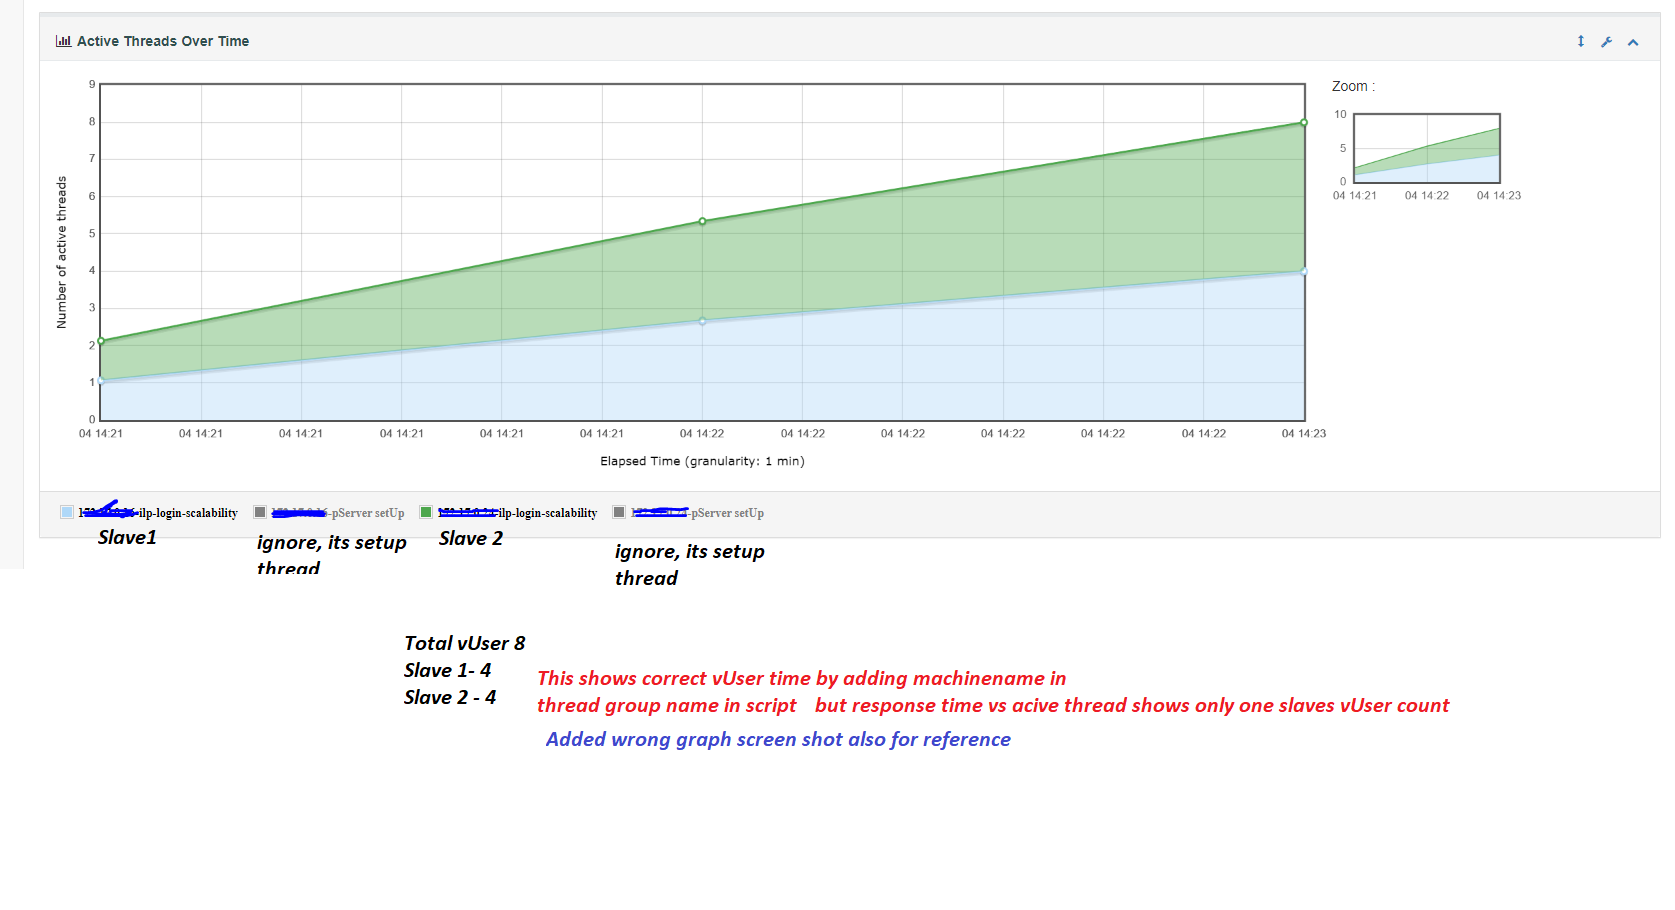
4 years ago Saurabh Barthwal (migrated from Bugzilla): Active thread vs time graph which shows correct combined thread count from both jmeter slaves.
Test details are mentioned in the attached file
Created attachment Correct-Active_threads_vs_time_graph.png: Active thread vs time graph which shows correct combined thread count from both jmeter slaves
 asfimport
commented
4 years ago
asfimport
commented
4 years ago Saurabh Barthwal (migrated from Bugzilla): (In reply to Philippe Mouawad from comment 1)
Hello, Can you provide jmeter.log file ? Thank you
I attached the log file as well some test graph info please see comments 2,3,4 in this bug
asfimport
commented
3 years ago @FSchumacher (migrated from Bugzilla): Could you attach a sample JTL file, that you use for the reports?
I think the problem is, that the processing logic looks at the number of threads reported by each worker node. Those nodes have no knowledge of the number of active threads on the other nodes and therefore report the number of active local threads.
The "Active threads vs time graph" groups by timestamp (which is the same on each worker node and can be used without problem). The grouped data splits on the thread name (which can be done, as it is unique among the cluster). This results in a correct reporting.
The "Response time vs thread graph" groups on the number of threads reported by the worker nodes (which is the number of local threads). As we have no knowledge of the timestamp (at least in the current implementation) and no knowledge of the other worker nodes state, these numbers are incorrect when seen from a global point of view.
I am not sure, how we can tackle this problem without introducing either uncertainty (by using assumptions, for example that every worker node has the same number of active threads at that point in time) or by combining the knowledge extracted from "Active threads vs time graph" and using it to interpolate the number of threads (doesn't work well with the current implementation).
Saurabh Barthwal (Bug 64118): In jmeter distributed environment and distributing load on multiple slave machines. after this running JMeter -g <csv file> -o <output folder> command to get HTML report from output CSV file. The report "Time Vs Threads" graph shows only one slave machine thread count instead of a combined thread count on x-axis.
e.g. if my slave 1 and slave 2 running 10 thread each but generated graph shows 10 number of active thread on X-axis of "Time Vs Threads" but it should be 20. It creates a problem during performance analysis.
It works fine with a single slave ((load generator)) if we increase the slave (load generator), count "Time Vs Threads" graph shows only one slave machine thread count.
Votes in Bugzilla: 2 Severity: major OS: All