Closed madduck closed 2 years ago
On x86-64 (Debian unstable) I see 85.4g for "VIRT" in top just a few seconds after starting up, but it doesn't seem to continue to grow. My guess is something in webkit (likely the JS interpreter) allocates a large amount of virtual space to play with but doesn't actually put anything in most of it.
I don't seem to see it using a lot of CPU. I also suspend and resume, but don't change XRandR layout so perhaps that's the trigger.
The huge virtual memory allocation is expected and its harmless. This is caused by the Gigacage feature of WebKit/JavaScriptCore:
Quoted from this blog post from Michael:
Gigacage works by allocating a huge address space to reduce the chances that an attacker can find pointers within that space, similar to ASLR, so limiting the size of the address space prevents Gigacage from working
But the high CPU usage is not expected, its a bug and should be fixed.
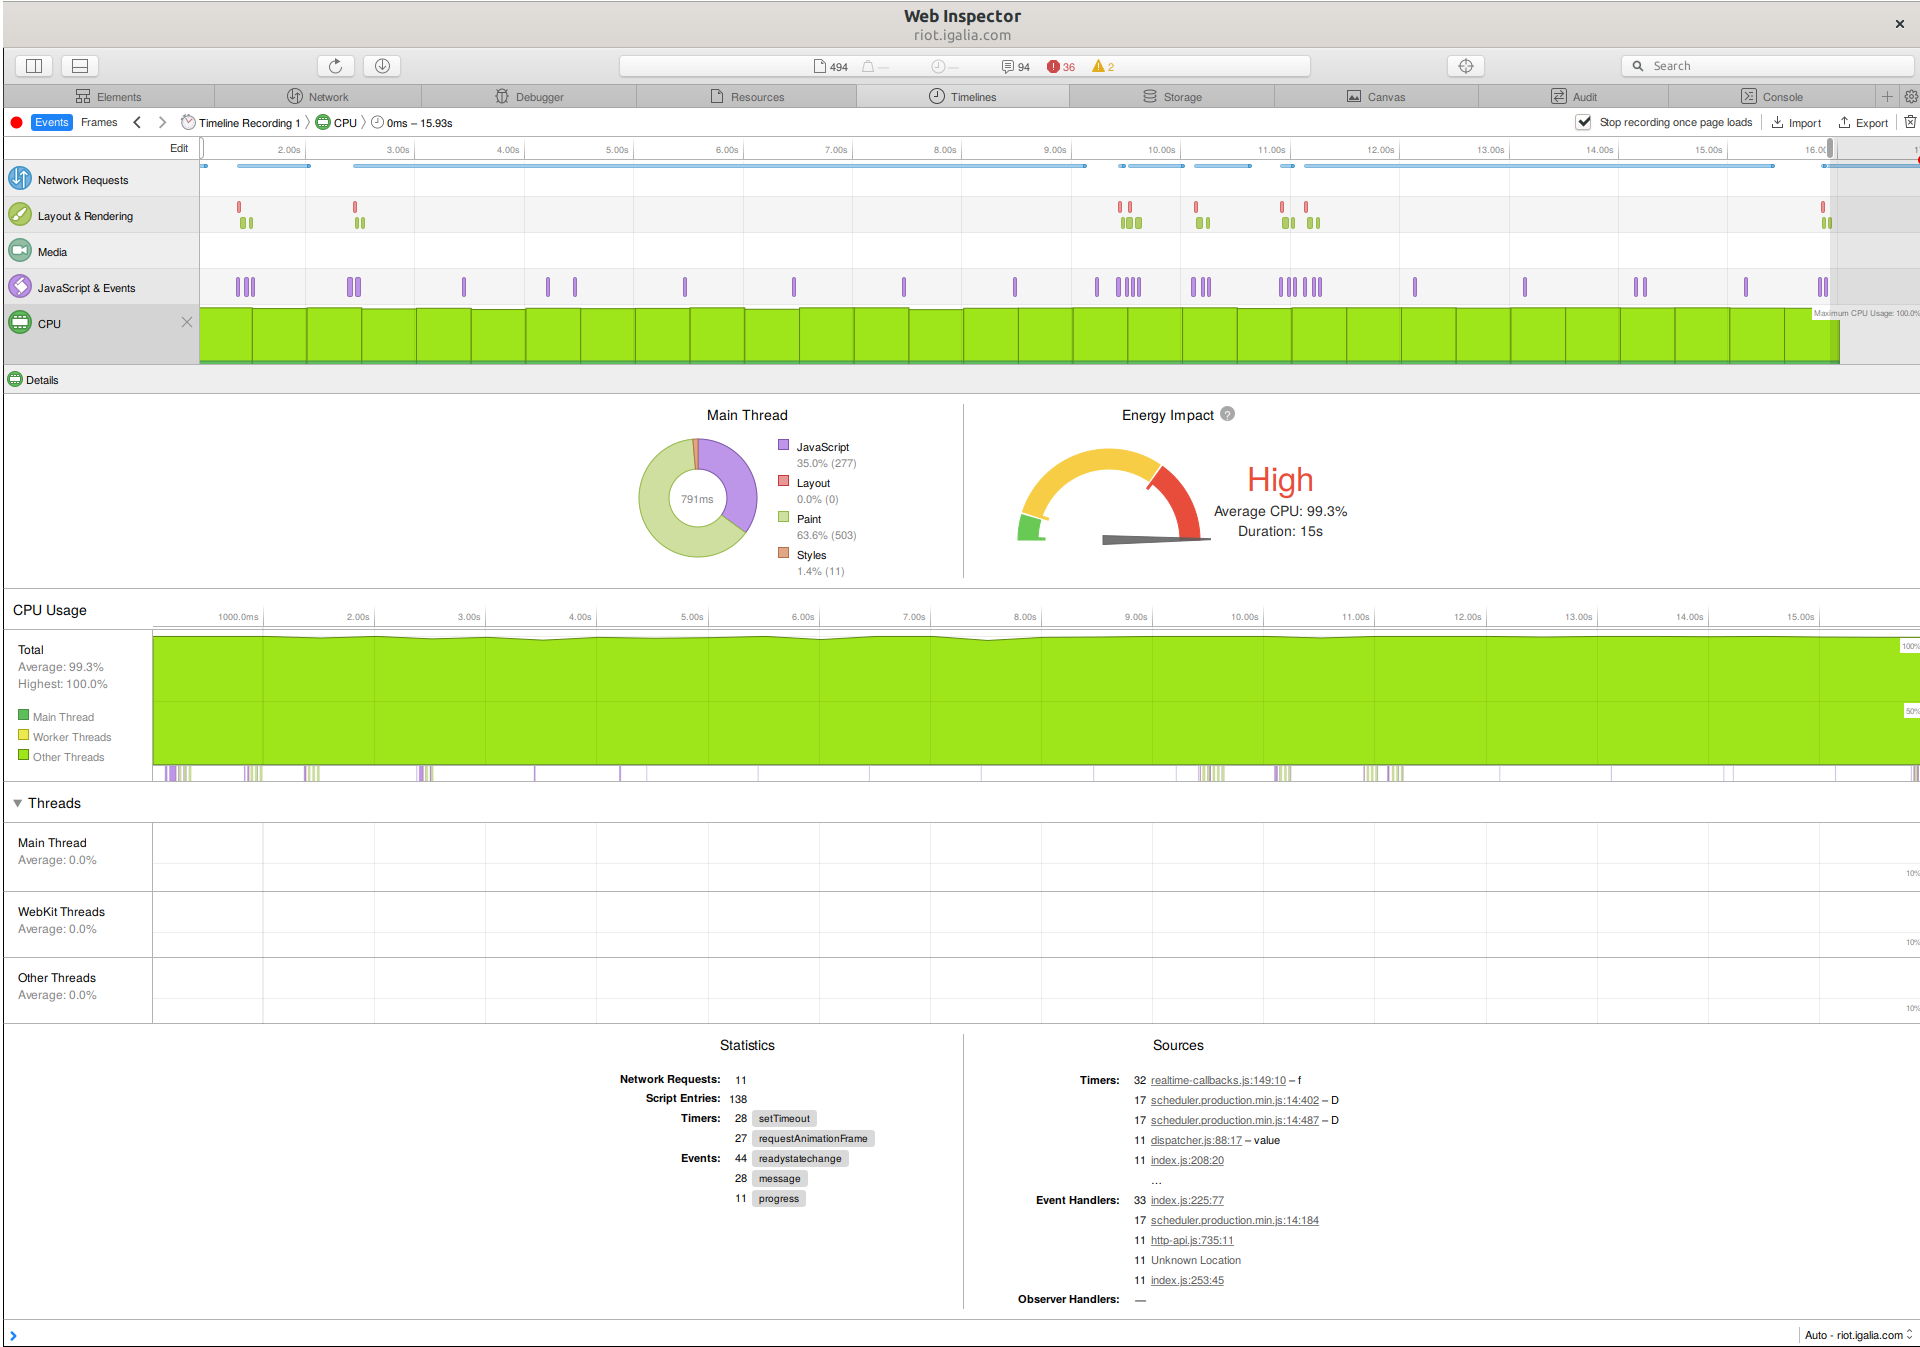
I'm also experimenting this issue with high CPU usage, for me it happens after a while (like after a few hours of having Revolt open). The workaround is to close and re-open it again. I have taken a record of it with perf when it was hogging the CPU. It looks like it's in a constant paint loop, maybe something is forcing repaint over and over. I also tried to debug it with the web inspector but I couldn't see anything relevant there. Just a bunch of JS timers happening each few seconds that take few time to complete. So at first it doesn't seem JS related.
I also tried to debug it with the web inspector but I couldn't see anything relevant there.
I correct myself. The other time I used the inspector wrongly. Now I can clearly see that there is a big issue with a constant repaint. It seems something inside riot is triggering constant repaints but I don't know what it is. The JS is minified and I'm not an expert on debugging complex web-apps. Check:
Looking at the riot bug tracker I see there are several bugs about high CPU usage also affecting chrome/electron.
Reported this issue also in the Riot bugtracker at https://github.com/vector-im/riot-web/issues/11652
The high cpu is not expected. What do you mean it's expected ?
I think you should re-read my message. I didn't say its expected :)
Update:
The issue with high CPU usage its related to a bug in WebKitGTK that triggers when AC mode its disabled.
Its possible to work-around it from Revolt by forcing AC mode always on. If you are interested in the workaround, then try a patch like this:
diff --git a/revolt/window.py b/revolt/window.py
index 21d7d19..cc95f4b 100644
--- a/revolt/window.py
+++ b/revolt/window.py
@@ -67,10 +67,8 @@ class MainWindow(Gtk.ApplicationWindow):
websettings.set_minimum_font_size(12) # TODO: Make it a setting
websettings.set_property("enable-mediasource", True)
if hasattr(websettings, "set_hardware_acceleration_policy"):
websettings.set_hardware_acceleration_policy(WebKit2.HardwareAccelerationPolicy.NEVER)
websettings.set_hardware_acceleration_policy(WebKit2.HardwareAccelerationPolicy.ALWAYS)
self._webview.show_all()
self.add(self._webview)
Update:
* The issue with high CPU usage its related to a bug in WebKitGTK that triggers when AC mode its disabled
BTW, in theory this should be fixed with WebKitGTK 2.28.2:
Fix excessive CPU usage due to GdkFrameClock not being stopped.
This issue has not been fixed. On my VNC client ( with Nvidia video driver ) I am forced to run software rendering. WebKitWebProcess pegs all 16 CPU's of a Zen3 5800X!
which version of revolt? can you try with last master?
@clopez Does the latest version matter? AFAIU, @KyleDave's problem is that he is using software rendering (which I guess it happens regardless of always enabling HW acceleration in Revolt).
Yeah, sorry, nothing to do with Revolt. I was just adding that WebKitWebProcess even at version 2.34 still has a problem on some web pages in Epiphany.
@clopez Does the latest version matter? AFAIU, @KyleDave's problem is that he is using software rendering (which I guess it happens regardless of always enabling HW acceleration in Revolt).
It does. The last commit from Revolt master is https://github.com/aperezdc/revolt/commit/7f6f762ebd67e51f1c356fa045b19be2c0264997 which enables always the AC compositing mode and was the one that supposedly fixed/workarounded this issue
Without that change, Revolt is unbearably slow to me (Using Intel Mesa GPU drivers and X11)
@clopez Does the latest version matter? AFAIU, @KyleDave's problem is that he is using software rendering (which I guess it happens regardless of always enabling HW acceleration in Revolt).
It does. The last commit from Revolt master is 7f6f762 which enables always the AC compositing mode and was the one that supposedly fixed/workarounded this issue
Without that change, Revolt is unbearably slow to me (Using Intel Mesa GPU drivers and X11)
I understand that, but how AC works when only software rendering is enabled? I suspect the performance would be bad nonetheless.
It depends on what "software rendering" in this context. If it means using Mesa llvmpipe driver I think it can perform OK. If it means forcing WebKit to disable AC via the environment variable WEBKIT_DISABLE_COMPOSITING_MODE then the previous change is a no-op. Since that will disable back AC mode on WebKit.
AFAIK The issue is a bug somewhere that makes WebKit performs really bad on Element/Matrix when AC is disabled, that is why the default was changed to be always enabled. With AC mode enabled the issue doesn't happen (at least for me)
Something is going on besides rendering. The CPU pegging happens only for full pages of search results - and it continues as long as the results are displayed. The page is done rendering in ~5 seconds. It is a static page except that each result has an event handler attached that shows a detail pop-up on mouseover.
Not long after starting
revolt
, the associated WebKitWebProcess will consume as much CPU as it can get (fortunately it is single-threaded), and keep allocating memory. For instance, this was in thetop
output just now, before I closed the process:So yeah, 84.6Gb of virtual memory, and 188:40.41 CPU time on a process that is just a couple of hours old.
I think this may be related to suspending/resuming, and/or XRandR layout changes (as I travel to and from office once in each direction per day), and I will update this issue as I find out more.