 rahmanusta
commented
7 years ago
rahmanusta
commented
7 years ago Hi @billziss-gh ,its usage should be like here https://github.com/asciidocfx/AsciidocFX/wiki/Chart-Extension#bar-chart
If I understand right you want to make grouping, but we don't have it
 billziss-gh
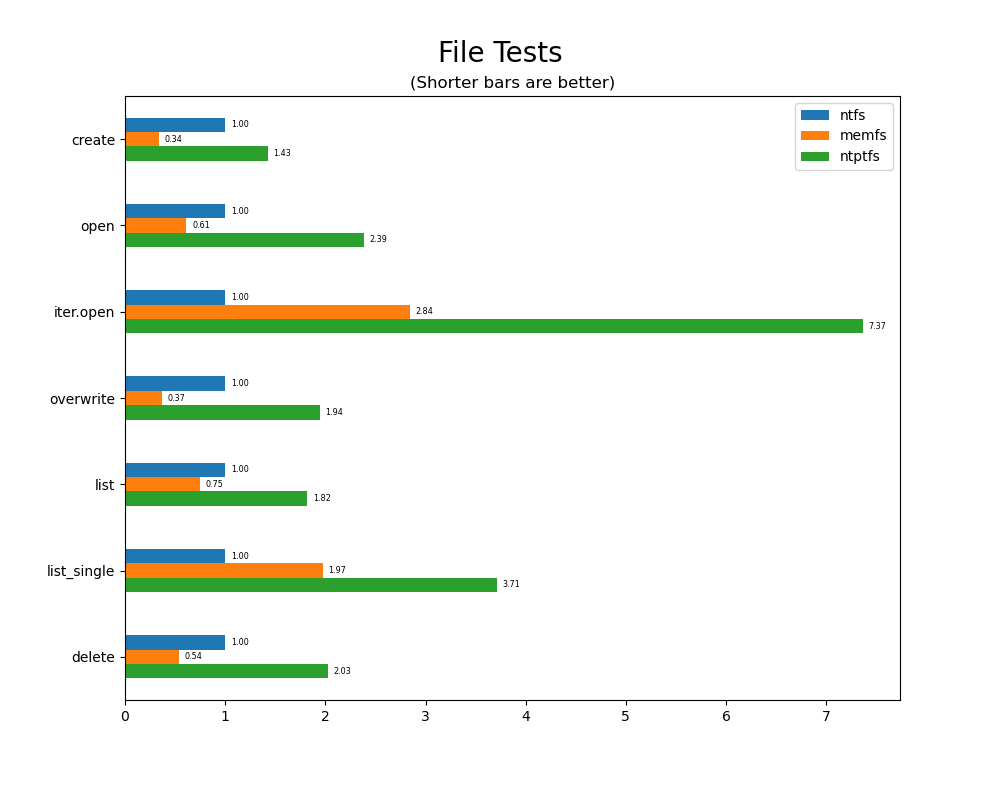
I am trying to chart the following data using a bar chart:
My expectation is to see a bar chart with x-labels:
file_create_test,file_open_test, etc. and individual bars for each of the series:ntfs,winfsp-t0, etc.I am seeing instead only bars for the first label
file_create_test. Here is a sample:Is this a supported scenario for AsciidocFX charts? Am I misusing AsciidocFX? Is there another way to achieve what I want?
This is on OSX with AsciidocFX version 1.5.5.