I was wondering how to interpret the colors when one is plotting multiple density maps together, does anyone know this? Say e.g. the example in the README:
How does one interpret the color in the middle? Is it possible to quantify the color by a color scale?
For example, if there are three blue dots in a pixel and two reds, does that make a purple pixel?
Hi all,
I was wondering how to interpret the colors when one is plotting multiple density maps together, does anyone know this? Say e.g. the example in the README: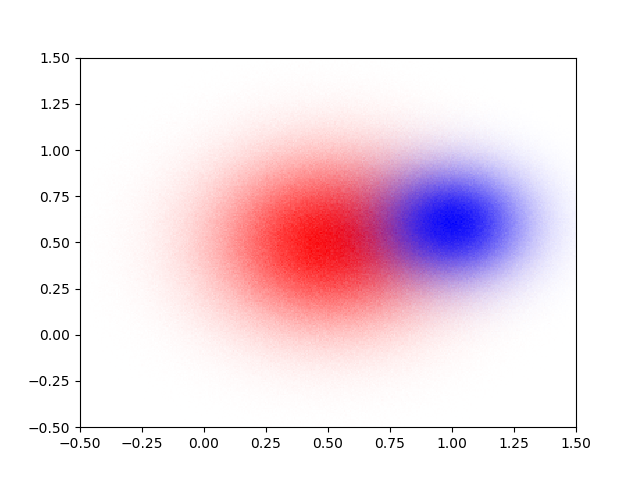
How does one interpret the color in the middle? Is it possible to quantify the color by a color scale? For example, if there are three blue dots in a pixel and two reds, does that make a purple pixel?
Thanks a lot!
Cheers,