 techwraith
commented
10 years ago
techwraith
commented
10 years ago Sorry, I just updated Prova and everything is working just fine!
Closed techwraith closed 10 years ago
techwraith
commented
10 years ago Sorry, I just updated Prova and everything is working just fine!
techwraith
commented
10 years ago Sorry to reopen this, but the callstacks in these errors aren't helpful - is there a way to fix this? https://cloudup.com/c4X6Pbo0IrY
techwraith
commented
10 years ago Just checking in on this one after the weekend
 azer
commented
10 years ago
azer
commented
10 years ago @Techwraith I'm in Portland until the next sunday, will have rare access to my computer
techwraith
commented
10 years ago No problem, thanks for looking getting back to me :)
On Tuesday, May 27, 2014, Azer Koçulu notifications@github.com wrote:
@Techwraith https://github.com/Techwraith I'm in Portland until the next sunday, will have rare access to my computer
— Reply to this email directly or view it on GitHubhttps://github.com/azer/prova/issues/16#issuecomment-44355102 .
azer
commented
10 years ago Hi, sorry for the late reply
Could you give me a sample test case that I can get the same output?
techwraith
commented
10 years ago Just clone this down:
https://github.com/Techwraith/prova-test-example
and run this command:
./node_modules/prova/bin/prova -b test.js -t hbsfythanks! I'll try it tonight
techwraith
commented
10 years ago How'd this go? Were you able to reproduce the issue that that code sample?
On Thu, Jun 5, 2014 at 12:43 PM, Azer Koçulu notifications@github.com wrote:
thanks! I'll try it tonight
— Reply to this email directly or view it on GitHub https://github.com/azer/prova/issues/16#issuecomment-45264904.
azer
commented
10 years ago I was actually working on domquery last night and already saw this error there too... We need some enhancements on generally showing the errors on the browsers actually. It's kinda tricky and definitely the first priority right now.
For now, you can open the source code on /assets/run.js and check the failing code with the line numbers.
azer
commented
10 years ago I've just released a new version of Prova that allows you browse around the error stack. You can click the stack lines and see the source code immediately. I hope it helps!
techwraith
commented
10 years ago I just updated prova and I'm not seeing any different functionality. What should I be looking for?
 joeybaker
commented
10 years ago
joeybaker
commented
10 years ago @azer kinda cool! It doesn't solve the problem for me, but it's nifty functionality.
azer
commented
10 years ago Actual improvements on this case actually would happen on the Tape side since we get the error objects from Tape stream
techwraith
commented
10 years ago Can you point me to the place in the code where that error comes from? If I use tape on it's own I get good error messages.
techwraith
commented
10 years ago Also, if I run Prova on the command line (not in the browser) I get good error messages. It seems to be a problem with Prova's front end reporting, not tape.
azer
commented
10 years ago Does Tape also give better error messages on browser? tape.createObjectStream is where we get the errors.
techwraith
commented
10 years ago This worked in a previous version of Prova. @joeybaker is going to track it down and report back. Thanks for looking into this.
joeybaker
commented
10 years ago I went back to 1.2.0 50cebaa49debce10c7e2612ea04a702bcb9a6812 and unfortunately, this is still broken :/
@azer does tape.createObjectStream not output the correct callstack?
azer
commented
10 years ago @joeybaker yeah, because the error produced is an uncatched JS error
azer
commented
10 years ago just noticed that tape throws the correct stack trace within the "actual" property instead "error" (which has another error object) and released a patch to switch between the correct error stack traces, now we show the correct failing lines on browsers too. hope it's gonna be helpful!
version :1.13.0 commit: da2139e9b15dbb387927af2880d92e818247be78
joeybaker
commented
10 years ago Nifty! Unfortunately, I'm still seeing stack traces coming from the prova stack:

        37709. = function (err, msg, extra) {
        37710.     this._assert(!err, {
        37711.         message : defined(msg, String(err)),
                        ^
        Error: TypeError: Attempted to wrap undefined property offrentItem as function
            at Test.assert (http://0.0.0.0:7559/assets/run.js:37602:54)
            at Test.bound [as _assert] (http://0.0.0.0:7559/assets/run.js:37466:32)
            at Test.error.Test.ifError.Test.ifErr.Test.iferror (http://0.0.0.0:7559/assets/run.js:37710:10)
            at Test.bound (http://0.0.0.0:7559/assets/run.js:37466:32)
            at Test.run (http://0.0.0.0:7559/assets/run.js:37483:14)
            at Test.bound [as run] (http://0.0.0.0:7559/assets/run.js:37466:32)
            at next (http://0.0.0.0:7559/assets/run.js:37280:15)
            at http://0.0.0.0:7559/assets/run.js:60952:21
My start command: prova -bel chrome -t hbsfy 'test/**/*test.js' Is there something additional that I should be doing?
azer
commented
10 years ago @joeybaker notice that it's showing the third line (37710) on the stack. any chance you accidentally clicked that line? it'd show the first line by default and you can navigate between those lines by just clicking
joeybaker
commented
10 years ago @azer No, The top image is a screen cap from in-browser and the second is a dump from the console (no clicking possible there :] ).
azer
commented
10 years ago @joeybaker notice the line number in the first row of the error stack in the screenshot: 37602. and the line in the source code: 37710. Are you able to click and switch to the first line? (e.g https://i.cloudup.com/42iYw0WnPP.gif)
And could you make sure that you're using the correct prova version? (if you're running the tests by "node test -b" command use "node test -v" for showing the version, if you're using the global command like "prova test -b" then see the version by "prova -v")
joeybaker
commented
10 years ago @azer yea, I can switch lines, but it doesn't tell me much.
> cat test/test.js
var test = require('prova')

test('stack traces', function (t){
  t.ok(false, 'ok!')
})
> ./node_modules/.bin/prova -v

  prova v1.13.0

> ./node_modules/.bin/prova -bel chrome test/**

  prova:browser Visit 0.0.0.0:7559 with a browser to start running the tests. +0ms

 { [Error: spawn ENOENT] code: 'ENOENT', errno: 'ENOENT', syscall: 'spawn' }
  prova:launch Launched chrome to visit http://0.0.0.0:7559 headlessly. +511ms

    stack traces
    Browser: Chrome v35 Engine: WebKit v537.36 OS: Mac OS X v10.9.3

        ok! http://0.0.0.0:7559/assets/run.js
                       v
        5425. = function (value, msg, extra) {
        5426.     this._assert(value, {
        5427.         message : msg,
                       ^
        Error: ok!
            at Test.assert (http://0.0.0.0:7559/assets/run.js:5345:54)
            at Test.bound [as _assert] (http://0.0.0.0:7559/assets/run.js:5209:32)
            at Test.ok.Test.true.Test.assert (http://0.0.0.0:7559/assets/run.js:5426:10)
            at Test.bound [as ok] (http://0.0.0.0:7559/assets/run.js:5209:32)
            at Test.<anonymous> (http://0.0.0.0:7559/assets/run.js:6005:5)
            at Test.bound [as _cb] (http://0.0.0.0:7559/assets/run.js:5209:32)
            at Test.run (http://0.0.0.0:7559/assets/run.js:5223:14)
            at Test.bound [as run] (http://0.0.0.0:7559/assets/run.js:5209:32)
            at next (http://0.0.0.0:7559/assets/run.js:5023:15)
            at http://0.0.0.0:7559/assets/run.js:2177:21

    Expected: true
    Actual:   ""
Compare to running the test only through node:
> prova test/**

    stack traces
    ok! /Users/joeybaker/server/prova-client-test-bug/test/test.js
               v
        3. test('stack traces', function (t){
        4.   t.ok(false, 'ok!')
        5.   t.end()
               ^
        Error: ok!
            at Test.<anonymous> (/Users/joeybaker/server/prova-client-test-bug/test/test.js:4:5)
            at processImmediate [as _immediateCallback] (timers.js:336:15)

        Expected: true
        Actual:   false

    1 failed, 0 passed assertions.
Here's the code: https://github.com/joeybaker/prova-client-test-bug
azer
commented
10 years ago The first line of the stack trace should show the failing line, rest will be tape and prova lines... so I'm curious what you see when you click "at Test.assert (http://0.0.0.0:7559/assets/run.js:5345:54)"
joeybaker
commented
10 years ago Gotcha. Here's what I get:

joeybaker
commented
10 years ago (worth noting: the actual value is set to "", when it should report false.)
azer
commented
10 years ago just fixed the bug about showing the false value, released as 1.13.1.
now it looks like this in my local:
test('stack traces', function (t){
  t.ok(false, 'ok!')
t.end()@azer that's great! On two levels!
false fix!Let me get some other co-workers to look at this on different machines, maybe my local env is messed up?
azer
commented
10 years ago arright, thanks a lot for reporting this and sorry for late fix! I hope it'll work
techwraith
commented
10 years ago I'm still seeing the wrong stack trace on my local machine:

techwraith
commented
10 years ago To clarify:
I cloned the test repo that @joeybaker linked to, did an npm install, and then did npm test. I didn't click anything, and this is the error that I'm getting.
azer
commented
10 years ago @Techwraith what happens if you start with "node test -b" ?
techwraith
commented
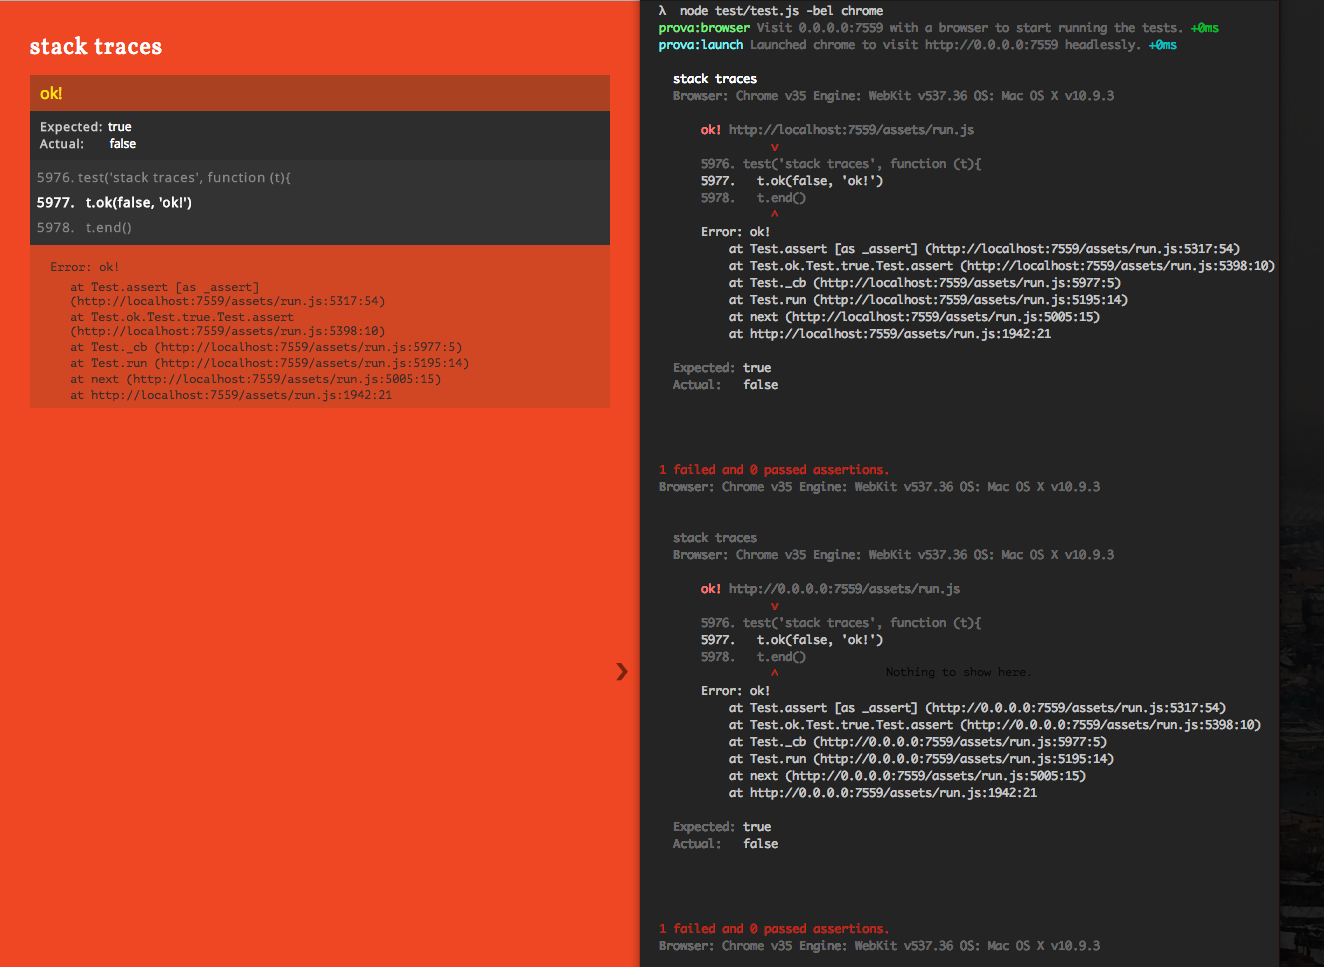
10 years ago Sure, this is what I get when I run ./node_modules/.bin/prova test/** -b

techwraith
commented
10 years ago Same thing if I run node tests/test/js -b
azer
commented
10 years ago I'm out of ideas unfortunately
Right now I'm seeing this error when running my test suite. I suspect one of my test files is throwing an error, but Prova doesn't show me any useful information. What can we do about this?
https://cloudup.com/cjJhMEU817G