 andrewthauer
commented
3 years ago
andrewthauer
commented
3 years ago OpenTelemetry seems worth considering on the implementation side.
Closed freben closed 1 year ago
andrewthauer
commented
3 years ago OpenTelemetry seems worth considering on the implementation side.
andrewthauer
commented
3 years ago Curious if any additional thoughts have been given to this? We are starting to look into emitting some metrics from the backend. Current use cases would be an incremented metric (statd) to track usage and also trigger alerts against it. We could integrate directly with our metrics provider, but might be nice to use a generalized API that abstracts this.
 Fox32
commented
3 years ago
Fox32
commented
3 years ago Right now prometheus metrics are available and it's easy to extend them with custom metrics. We just through about adding an entity count metric. Not sure if that is something we should provide for everyone.
 freben
commented
3 years ago
freben
commented
3 years ago @Fox32 In what way do you mean that they are available?
@andrewthauer Yeah I'm not sure how to best abstract this. We could either inject a bunch of actual metrics code in the backend at strategic points, maybe using some form of shim that you have to attach a real telemetry lib on top of. But that seems like a lot of work, and inventing that shim may be a thankless job and a new API surface to maintain. An alternative would be to do the same and just harshly pick the most common choice of library (opentelemetry seems like it, right?), and if an adopter wants something else, they will have to run a translation layer from that to their system. A third approach would be to add just a couple of subscribable event emitters here and there that are sufficient to tie metrics analysis + emission to. Like, a generic onEntityAddedOrRemoved({ entity, action, timeTaken }) listener could turn around and read all entities and emit metrics based on the count and the time taken.
We haven't picked a design at all for this yet, and all input is welcome.
Fox32
commented
3 years ago In what way do you mean that they are available?
There are basic metrics available in the backend at /metrics: Things like: NodeJs specific stuff like memory usage, gc, http requests, ...
It is also possible to extend it with custom once, like in #3512 I don't think that this is a full telemetry setup, but a nice start.
About open telemetry: I think that is a good way to go and the prometheus format is more or less the base for metrics there.
andrewthauer
commented
3 years ago We are using datadog. I know they've talked about supporting opentelemetry but I'm not sure on the status or scope of that. We already have APM & logging configured. but now it's a matter of figuring out strategic places for metrics, etc. Will also need to look at ensure distributed tracing is working as well. For that, I suspect an express middleware may help for part of it.
Fox32
commented
3 years ago Prometheus metrics should work with datadog, but I have never done that. I think distributed tracing will become more relevant once the Backstage backend consist of more than one process - so it's definitely something we should have.
For the observability of the frontend @dhenneke invested some time this week into integrating Sentry. That work is only done in our app, but we noticed some things that could be changed in Backstage to make such an integration easier.
andrewthauer
commented
3 years ago @Fox32 - Yeah, I do see it's possible to integrate with Prometheus, but at first glance it seems like it's more then just a client adapter.
I think having tracing is useful even with a single process backend. For instance, I would like to trace calls to and from other non backstage internal services.
Fox32
commented
3 years ago For instance, I would like to trace calls to and from other non backstage internal services.
I didn't had that in view. Most of the services we talk to via Backstage are out of our control, but if you have internal services, it's a good fit.
 regicsolutions
commented
3 years ago
regicsolutions
commented
3 years ago plus 1 for datadog there's a Winston Datadog Logger out there that may be a good start
andrewthauer
commented
3 years ago plus 1 for datadog there's a Winston Datadog Logger out there that may be a good start
The nice thing is adding new transports is already easily accomplished in a custom backend app by using getRootLogger() and adding it to as usual with Winston.
 Rugvip
commented
3 years ago
Rugvip
commented
3 years ago Bunch of discussion on the metrics topic in #3512 that we shouldn't lose track of
andrewthauer
commented
3 years ago For datadog metrics, this works well - https://github.com/DataDog/node-connect-datadog. I plugged this in by creating a packages/backend/src/plugins/metrics.ts file:
import connectDatadog from 'connect-datadog';
import { PluginEnvironment } from '../types';

export default async function createRouter({ config }: PluginEnvironment) {
  const appName = config.getOptionalString('backend.appName') ?? 'backstage';
  const appEnv = config.getOptionalString('backend.appEnv') ?? 'development';

  const options = {
    response_code: true,
    tags: [`appname:${appName}`, `appenv:${appEnv}`],
  };

  return connectDatadog(options);
}
And then registered it with addRouter in packages/backend/src/index.ts.
regicsolutions
commented
3 years ago For
datadogmetrics, this works well - https://github.com/DataDog/node-connect-datadog. I plugged this in by creating apackages/backend/src/plugins/metrics.tsfile:import connectDatadog from 'connect-datadog'; import { PluginEnvironment } from '../types'; export default async function createRouter({ config }: PluginEnvironment) { const appName = config.getOptionalString('backend.appName') ?? 'backstage'; const appEnv = config.getOptionalString('backend.appEnv') ?? 'development'; const options = { response_code: true, tags: [`appname:${appName}`, `appenv:${appEnv}`], }; return connectDatadog(options); }And then registered it with
addRouterinpackages/backend/src/index.ts.
@andrewthauer how has node-connect-datadog been working out for you? Looking to see if i can ship logs over to datadog and get some metrics, what type of metrics are you capturing?
andrewthauer
commented
3 years ago @regicsolutions - We haven't added anything beyond what the middleware is currently providing atm.
 joscha
commented
3 years ago
joscha
commented
3 years ago I came here after looking for answer on how to debug a catalog loading issue in production. After looking at the source code I can't see an easy way to log
It would be great if we could use the already injected winston logger in more places, especially wen it comes to reading (github) URLs - thoughts?
regicsolutions
commented
3 years ago @regicsolutions - We haven't added anything beyond what the middleware is currently providing atm.
Thanks! Found this one today, looks interesting: https://github.com/DataDog/build-plugin
andrewthauer
commented
3 years ago Thanks! Found this one today, looks interesting: https://github.com/DataDog/build-plugin
Yeah we ran across that recently as well. Not sure it's applicable directly to observability within backstage, but I think it would be neat if backstage could surface the build profiles for components in the catalog 😀.
 GoWind
commented
3 years ago
GoWind
commented
3 years ago We are currently attempting to integrate opentracing using the lightstep, opentracing client, in the Catalog for this.
Currently, I am trying to provide an instrumented HTTP client to the custom CatalogProcessors that we registered, for tracing requests made by our processors. This looks like it might work out well so far.
What is perhaps missing is a way to provide an instrumented connection pool , that can emit logs or opentracing spans. I would like to know the latency/metrics for my database requests and currently there is no way for me to get those numbers (not that I am performance focused, at the moment, but in terms of pure observability).
Perhaps a way to provide a instrumented connection pool would be useful for the community ? I know that there are a lot of options for doing this, but in order to accommodate as many solutions as possible, we perhaps can allow users to provide instrumented clients that have the same interface as that of the default connection pool on the catalog-backend.
freben
commented
3 years ago We are currently attempting to integrate
opentracingusing the lightstep, opentracing client, in the Catalog for this.
Cool! In an open sourceable way?
Currently, I am trying to provide an instrumented HTTP client to the custom
CatalogProcessors that we registered, for tracing requests made by our processors. This looks like it might work out well so far.
You know I've been thinking that we would like to instrument fetch and inject it where necessary, instead of importing directly. But the rub is, we'd probably want to do it on a per-request basis, so that we can propagate information such as tracing, auth etc properly. So we'd probably have to pass a request context around everywhere, or have it use globals somehow.
Maybe I should look into that for our hack week 🤔
What is perhaps missing is a way to provide an instrumented connection pool , that can emit logs or opentracing spans. I would like to know the latency/metrics for my database requests and currently there is no way for me to get those numbers (not that I am performance focused, at the moment, but in terms of pure observability).
Perhaps a way to provide a instrumented connection pool would be useful for the community ? I know that there are a lot of options for doing this, but in order to accommodate as many solutions as possible, we perhaps can allow users to provide instrumented clients that have the same interface as that of the default connection pool on the
catalog-backend.
That makes a lot of sense. Something useful here? Seem to be specifically for pg, not at a knex level https://github.com/open-telemetry/opentelemetry-js-contrib/tree/main/plugins/node
freben
commented
3 years ago Also https://github.com/myrotvorets/opentelemetry-plugin-knex . But that seems to have very limited version support and is hacky
GoWind
commented
3 years ago Cool! In an open sourceable way? Opentracing is a spec/protocol/interface for interoperable tracing. The opentracing initiative provides a JS
tracerwrapper , that is used as the interface.
https://github.com/opentracing/opentracing-javascript
The globalTracer has to be initialized with a Tracer implementation. We use lightstep as a company wide tracing implementation, but this can be swapped in and out.
I currently do not have the bandwidth to contribute to backstage :/ , but will have some time in a few weeks to provide some suggestions and ideas/contributions.
You know I've been thinking that we would like to instrument fetch and inject it where necessary, instead of importing directly. But the rub is, we'd probably want to do it on a per-request basis, so that we can propagate information such as tracing, auth etc properly. So we'd probably have to pass a request context around everywhere, or have it use globals somehow.
The biggest problem for me was storing the spans and passing it along in the request, so that the spans can create sub-spans . I cannot use a global variable, as node is single threaded. I seem to have found only one solution to have some sort of a state for a request, that can also be passed to all the callback fns, invoked by the request.
https://www.npmjs.com/package/continuation-local-storage
But this library hasn't been updated in 3 years, so wondering if it still makes sense to use it ?
Looks interesting, I will take a look at it. can knex operate on a pg object (IIRC, knex has a different way of handling connections etc). But I will have to investigate this further.
freben
commented
3 years ago Opentracing is a spec/protocol/interface for interoperable tracing. The opentracing initiative provides a JS
tracerwrapper , that is used as the interface.
Sure :) I meant if the Backstage specific adaptations (if/where applicable) would be contributed.
I currently do not have the bandwidth to contribute to backstage :/ , but will have some time in a few weeks to provide some suggestions and ideas/contributions.
Looking forward to it! Let us know if we can help somehow.
https://www.npmjs.com/package/continuation-local-storage
But this library hasn't been updated in 3 years, so wondering if it still makes sense to use it ?
Yeah I've seen that before, seems a bit scary. If I understand it correctly, it relies on very old APIs that were stripped already in the node 0.x days. Nowadays we have the async hooks stuff instead.
Looks interesting, I will take a look at it. can
knexoperate on apgobject (IIRC, knex has a different way of handling connections etc). But I will have to investigate this further.
As far as I know, knex just uses plain pg / mysql under the hood whether you want to or not, so it should be transparently used as long as the instrumentation is attached on that layer.
freben
commented
3 years ago GoWind
commented
3 years ago Some simple googling revealed https://nodejs.org/docs/latest-v14.x/api/async_hooks.html#async_hooks_class_asynclocalstorage. Perhaps this is an interesting API i can purse . Also this seems stable (or might be stabilized) so perhaps can be exposed with a feature flag for consumers.
https://nodejs.org/docs/latest-v14.x/api/async_hooks.html#async_hooks_class_asynclocalstorage
 dhenneke
commented
3 years ago
dhenneke
commented
3 years ago We tried to integrate opentelemetry with Jaeger a few weeks ago but it didn't helped us with our problem then and we didn't find the time to actually get it running like we wanted to. We got automatic express and pg tracing working but didn't looked into how to propagate the context to the api clients.
I dump our experimental code here in case it might help anyone.
We only got it to run if opentelemetry runs before anything else happened in the node process. Since the backend/src/index.tsx was too late for some reason, we went with a not-really-satisfying node -r @internal/backend-tracing packages/backend ….
GoWind
commented
3 years ago @dhenneke : I have the same problem.
I am investigating use a middleware that can wrap AsyncLocalStorage. My idea is we set a LocalStorage state and then use it to propagate the root span. Any instrumented code can then try accessing the AsyncLocalStorage's state and then creating child contexts.
If this works, I will update this issue. Perhaps then we can have a narrative for backstage to provide a common AsyncLocalStorage based API for propagating observability information.
GoWind
commented
3 years ago So I found a workable solution using AsyncLocalStorage from the async hooks node library.
It has been introduced since 13.x, so support is available only for recent node versions.
a global AsyncLocalStorage instance can be exposed via a module that can then be used in something like a middleware to wrap the context.
It will be something like
middleware = () => {
 span  = getSpanFromRequest(req);
asyncstore.run(span, {
 next()
});
res.xxx
}
I am currently testing this out and verifying how it works well with other libraries and possible APIs. I will have some time to contribute soon. If no one works on this by then, I can contribute to this.
 kiranpatel11
commented
3 years ago
kiranpatel11
commented
3 years ago For audit logging key events, does it make sense to provide abstract api similar to identityApi that can be used by other plugin for consistency and also incase of frontend event/error reporting abstracted from implemetation platform's api - splunk, elasticsearch, newrelic, sentry etc.
e.g. event structure (inspired by opentelemetry log model)
{
"event" : "ComponentCreated",
"user" : "xyz@acme.org",
 attributes : {
        "templateUsed" : "spring-boot-rest-template",
         "templateVersion" : "v3",
         "plugin" : "scaffolder-backend"
  }
}@GoWind there's also https://github.com/Jeff-Lewis/cls-hooked that i linked above that supports older versions of node
freben
commented
3 years ago I just wanted to also mention that async hooks may come with significant performance impact on promise-heavy code such as the backend.
https://github.com/bmeurer/async-hooks-performance-impact
https://github.com/nodejs/benchmarking/issues/181
To be clear, I think it may still be worth it. As we trace and audit and measure and log structurally etc etc, it'll be super valuable to actually have a proper scope context.
GoWind
commented
3 years ago the impact doesn't look too big, IMHO. Also the node version seem quite old and it is possible that V8/Node improved the performance. Nevertheless, the performance hit should be worth the tradeoff in terms of observability and in the case of any I/O heavy application, the dominant contribution to latency will be from I/O (network, database) etc.
GoWind
commented
3 years ago @freben : I would like to take a shot at this and provide this in a backwards compatible way. Would you be still interested in a PR ? (maybe via the backend-common)
 joaomilho
commented
3 years ago
joaomilho
commented
3 years ago Would be nice to extend this convo to the backstage-cli itself as a way to measure and improve DX when developing backstage. This impl would allow to trace full processes (app:build) but also breakdown the steps for it. This would be important for long running commands like start, since one doesn't wanna know how much time it took in general (could be days!) but how much time it takes to get it running and its steps. A candidate for the implementation is https://nodejs.org/api/perf_hooks.html and then which metrics format to use and how to send these could be aligned with the frontend/backend. Here are some requirements from my head:
 stale[bot]
commented
3 years ago
stale[bot]
commented
3 years ago This issue has been automatically marked as stale because it has not had recent activity. It will be closed if no further activity occurs. Thank you for your contributions.
 TejasQ
commented
2 years ago
TejasQ
commented
2 years ago At the very least, it can be quite beneficial to forward all X-Cloud-Trace-Context headers that we receive when fetching data. For example:
router.use('/get-dummy-stuff-from-other-service', (req, res) => {
  const data = await fetch('other-service/dummy', {
    headers: {
      'X-Cloud-Trace-Context': req.headers['X-Cloud-Trace-Context']
    }
  }).then(r => r.json())

  res.json(data);
})
It's a really hand-wavy basic example, but I hope it clearly sheds light on what I'm suggesting.
The X-Cloud-Trace-Context header is part of what was the OpenCensus specification and what is today called OpenTelemetry, so I can imagine it being valuable to all of our users who implement the spec.
We can alternatively provide a decorated fetcher that handles all of this to plugins/other parts of Backstage that deal with data fetching.
Let me know if I can open a PR to help this.
 chriskilding
commented
2 years ago
chriskilding
commented
2 years ago Would audit logs (i.e. a record of which Backstage user initiated a given action(s) and when) be regarded as part of this RFC?
Audit logs have been mentioned before in the specific case of the scaffolder-backend plugin (https://github.com/backstage/backstage/issues/4592), but it was acknowledged that they are more general than that, and should permeate all (relevant) actions in Backstage.
We have a requirement for our Backstage installation at work (currently in development) to be able to log this information, so we have an interest in this feature coming into existence.
 jbadeau
commented
2 years ago
jbadeau
commented
2 years ago Hello, we at Six are working on an observability plugin that supports any open telemetry (OTEL) compatible platforms. The main features are
In addition to common metrics like p99, error rate, and request per second, we also plan to leverage backstage metadata to bring insight not easily possible with existing platforms.
Of note is the fact that we also support payload capturing which opens up some very cool opportunities relating to service virtualization and consumer-driven contracts
Would be interested in presenting what we have and getting some feedback. Would love to opensource this.
Quick peek https://user-images.githubusercontent.com/152763/159518979-f5f4bc49-88dd-4f9e-89d9-9d0ec396ef2e.mp4
regicsolutions
commented
2 years ago Looks great @jbadeau
Would be cool to have a graph view like jaeger has, maybe using the same catalog-graph plugin 😃

https://cloud.redhat.com/blog/microservices-and-the-observability-macroheadache
jbadeau
commented
2 years ago Currently we have instrumented backstage front end and backend as well as provide an actual UI. As already asked by someone. This plugin is not proposing any extensions, hooks or apis to instrumemnt backstage itself. Therefore, I will move this topic out and find a better place for it. Sorry for the confusion.
On the RFC itself. I have a few suggestions based on having already instrumented backstage.
I wouldn't mind supporting here.
freben
commented
2 years ago @jbadeau Ah, great work! That's awesome. Would you look at implementing a complete package that can show and correlate all types of info, or would it show a summary of the most important pieces of info in Backstage itself and then link out to the third party to get the full picture? That can be a balancing act between how much code to write and the maintenance of that (plugins can start turning into entire products! :)), versus getting too little info in Backstage and constantly having to leave the page. Please don't take this as a negative remark, I don't want to take anything away from the great work you're doing - just wanted to mention that balance and get a discussion going. Well, OK, maybe in a separate ticket I guess. :)
Yep trace propagation should be a first to look at. The fetchApi is a natural place to start, it should for sure have a middleware that ensures that trace data is in place.
jbadeau
commented
2 years ago We are building 2 distinct plugins:
backstage-otel which will provide support for instrumenting various parts of backstage frontend and backend including plugins. I am not sure if this will be a backstage plugin or an otel js agent extension. will know more in a few days.
plugin-observability which will provide a complete UI for observability including Tracing, Logs, and Metrics and Alerts. You should not need to leave backstage to perform root-cause analysis, performance verification, Alert handling, etc. The observability views can and should be supplemented with domain specific views provided by 3rd parties/users. We will NOT be providing a observability platform but rather provide multiple ways to integrate with commercial, OSS, and private tools.
We plan to announce offical Backstage adoption very soon (next weeks) including opensourcing certain parts. From that point on I would submit our plan and open the repos for the public. We can then see what makes sense to contribute to RFCs and what is a 3rd party plugin(s).
jbadeau
commented
2 years ago @regicsolutions already on it :P
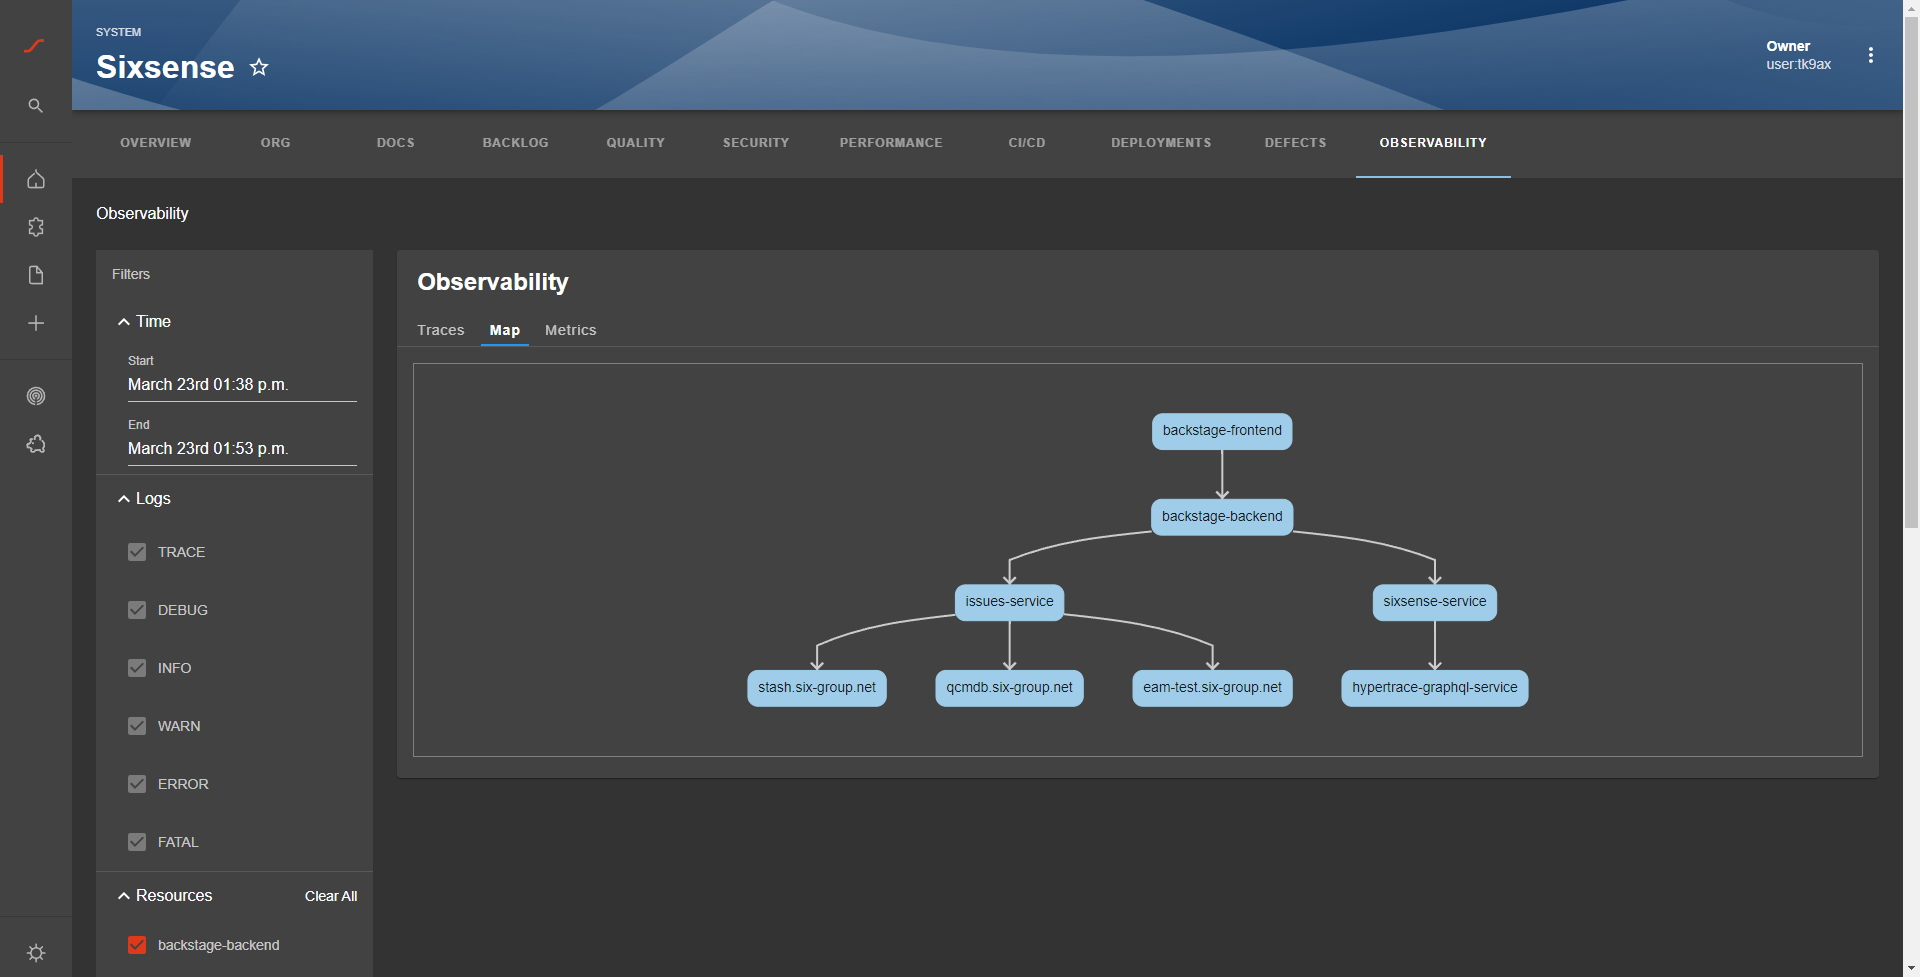
Its still basic but will add icons for types, links and meta info for nodes and edges.
jbadeau
commented
2 years ago @freben in order not to pollute this issue. Where would you recommend to open up a discussion? Should I create a new issue? Would a slack discussion be better?
freben
commented
2 years ago An opentelemetry plugin suggestion issue, along with stating that you're already far along, might make sense https://github.com/backstage/backstage/issues/new?assignees=&labels=plugin&template=plugin_template.md&title=%5BPlugin%5D+THE+PLUGIN+NAME
regicsolutions
commented
2 years ago @regicsolutions already on it :P
Its still basic but will add icons for types, links and meta info for nodes and edges.
Awesome, love it!
 jrusso1020
commented
1 year ago
jrusso1020
commented
1 year ago @jbadeau is there any update on your teams work regarding observability and Backstage? Specifically interested in the open telemetry aspects, we have been migrating all workloads at our company to open telemetry and would be great for Backstage to utilize it as well
 github-actions[bot]
commented
1 year ago
github-actions[bot]
commented
1 year ago This issue has been automatically marked as stale because it has not had recent activity. It will be closed if no further activity occurs. Thank you for your contributions.
 pjungermann
commented
1 year ago
pjungermann
commented
1 year ago @jbadeau would you mind sharing an update on the two plugins you were working on?
jbadeau
commented
1 year ago Unfortunately I couldn’t get the permission to open source the plugins. But I’m now at another company and will pick up the topic again. Hopefully with a more open approach
This RFC does not propose solutions, but rather looks for community input.
When deploying Backstage, both frontend and backend parts will benefit from rich observability:
This issue aims to gather input from the community on what solutions they use and/or value to have in production, and would like to see in place for Backstage. To this end, it is probably useful to think in terms of the full picture, being able to track behaviours across both frontend and backend, and looking at solutions that offer several of the above pieces at the same time.