 tonanuvem
commented
5 years ago
tonanuvem
commented
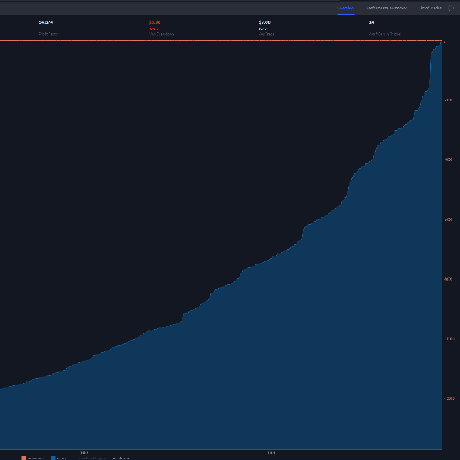
5 years ago Try first getting some metrics from prometheus: Open http://IP:9090
type “node_memory_MemFree_bytes” then click on “Execute” and then click on “Graph”
You can try to visualize other metrics:
node_boot_time_seconds node_filesystem_free_bytes node_filesystem_free_bytes{fstype="xfs|ext4"} node_filesystem_size_bytes
 Karlheinzniebuhr
I'm not able to make a working query (tested in prometheus) to pull data into Grafana. The option "metrics" seems to be nonexistent in Graphs. Any idea or example on how to create a graph in Grafana?