ben-manes / caffeine

A high performance caching library for Java
Apache License 2.0
15.8k stars 1.59k forks source link

Throughput issues / threads are parked #1742

Closed JohannesLichtenberger closed 2 months ago

JohannesLichtenberger commented 2 months ago

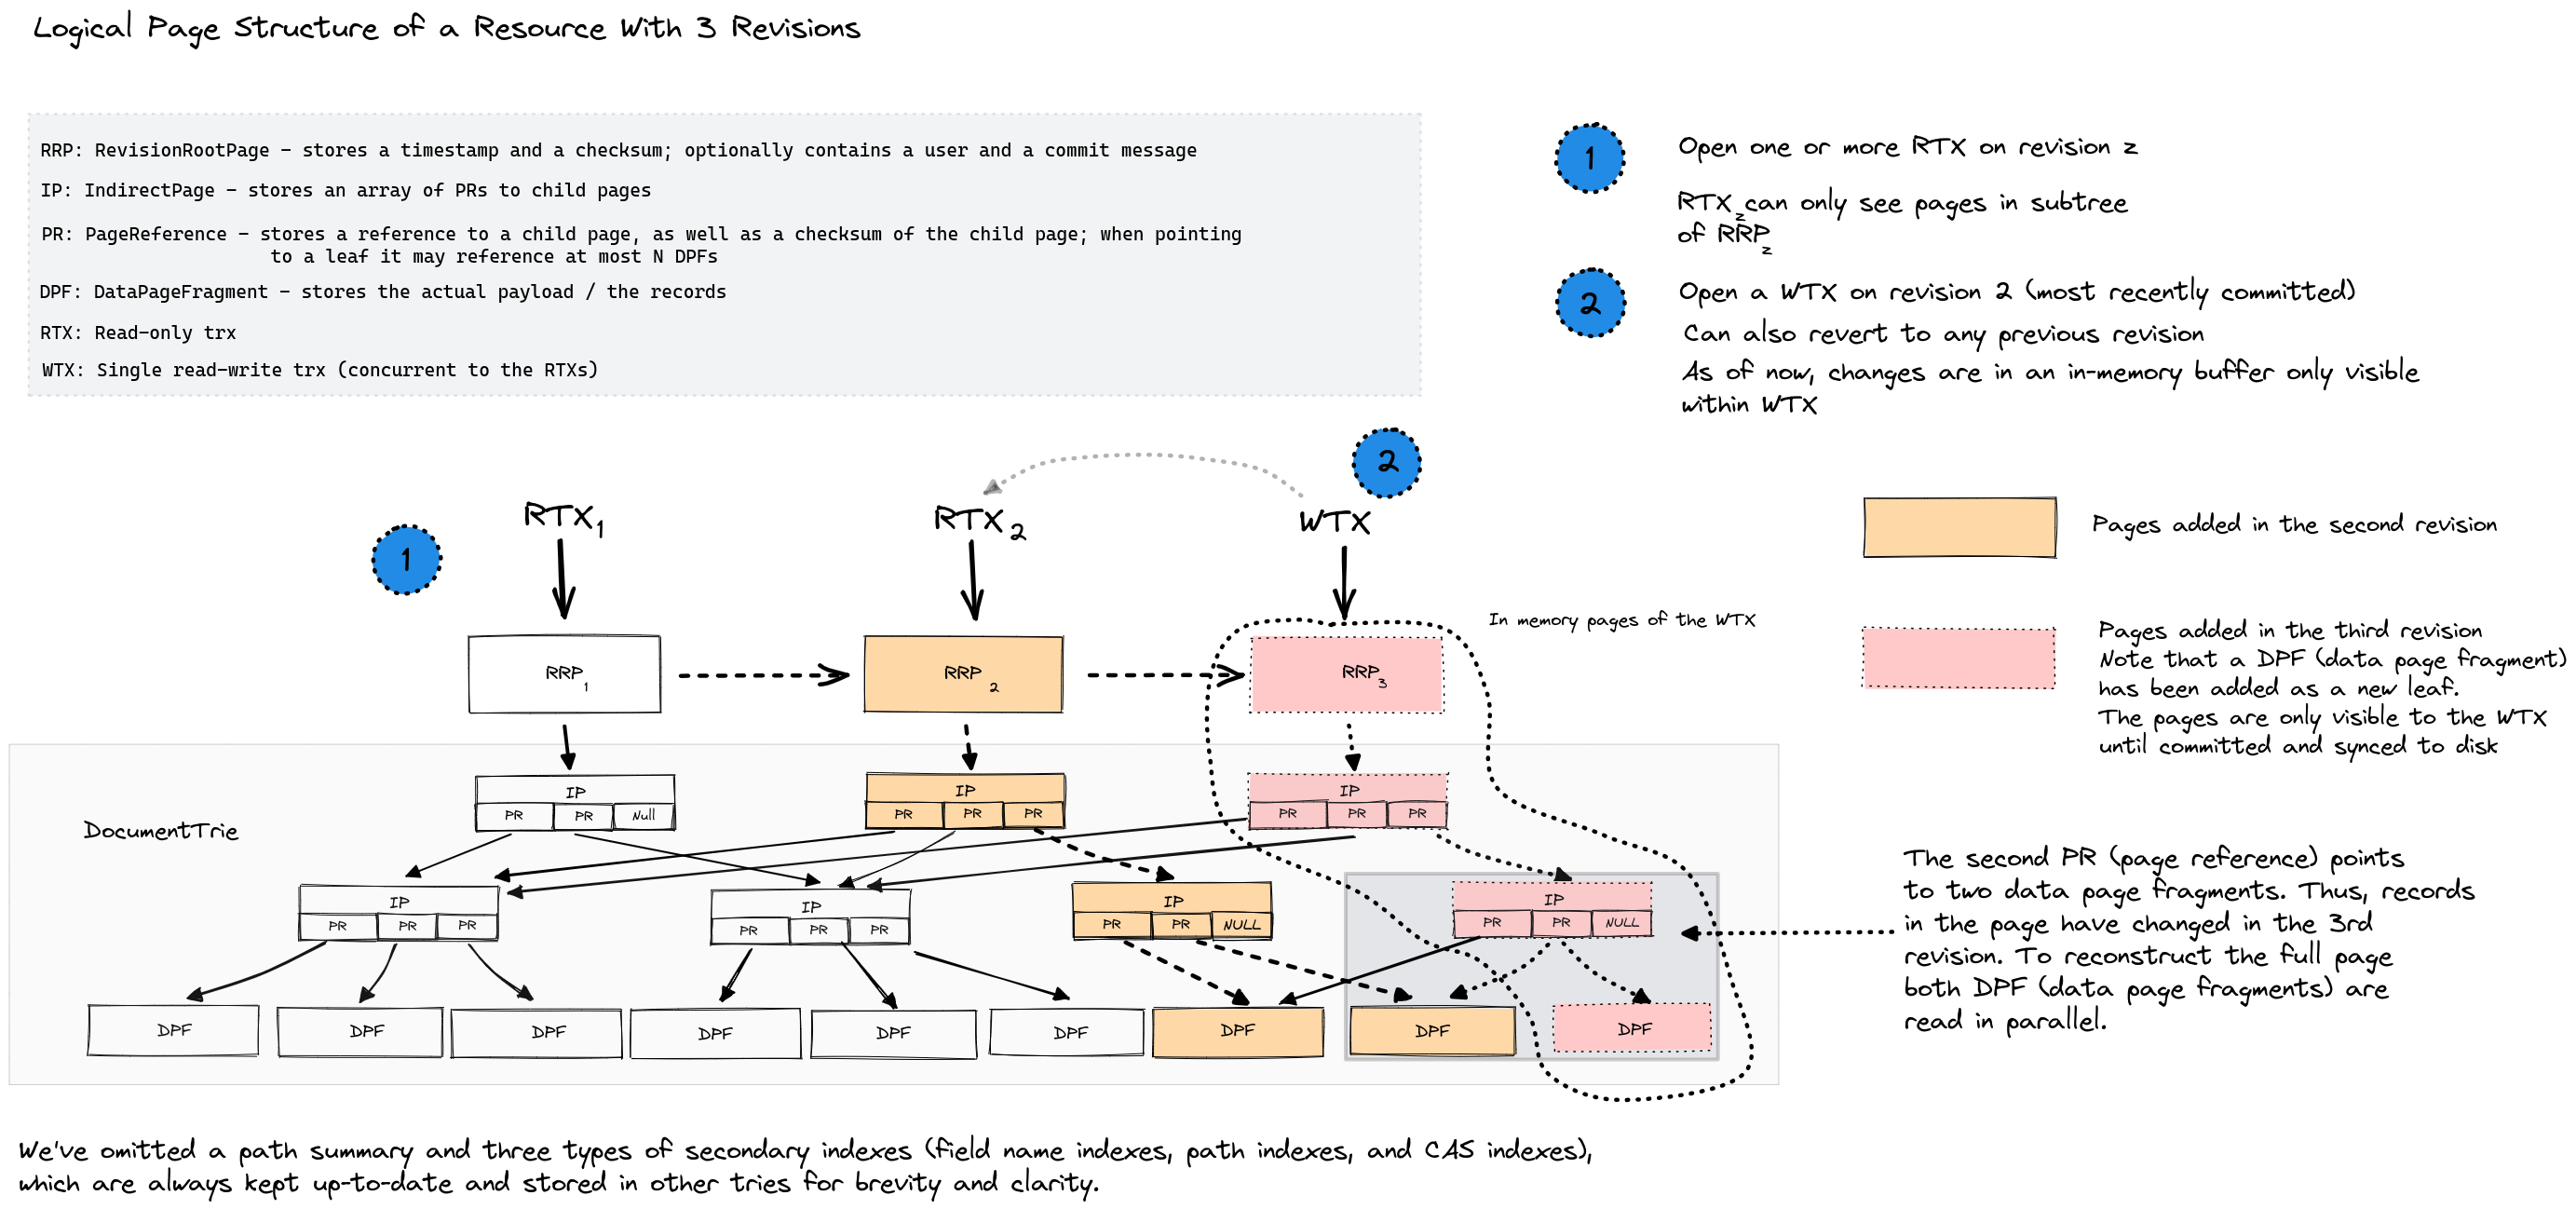
I've configured a couple of caches for SirixDB (https://github.com/sirixdb/sirix) as follows:

                        .maximumSize(maxSize)
                        .expireAfterAccess(5, TimeUnit.MINUTES)
                        .scheduler(scheduler)
                        .removalListener(removalListener)
                        .build();

The scheduler is simply the system scheduler Scheduler scheduler = Scheduler.systemScheduler();.

When running two or more read-only transactions (which do not share anything besides the page caches), one of the threads is always parked. I'm unsure why, but it concerns a weird Caffeine configuration or usage. When I'm not using the cache, it works as expected (but runs into an OutOfMemory issue, of course, as I'm consistently adding references to in-memory pages, which are set to null on eviction).

https://github.com/sirixdb/sirix/blob/31220326fec453d6c6b61924a94967ba5c1a885b/bundles/sirix-core/src/test/java/io/sirix/service/json/shredder/JsonShredderTest.java#L78 (I've simply used a hardcoded 2 or 3 for the CPU count and thus, the trx count, despite having 20 cores on my laptop -- but Sirix also reads up to 4 page-fragments in parallel if it has been modified frequently, to reconstruct a full page in-memory).

The page cache (for inner pages of a tree of tries): https://github.com/sirixdb/sirix/blob/main/bundles/sirix-core/src/main/java/io/sirix/cache/PageCache.java

And a https://github.com/sirixdb/sirix/blob/main/bundles/sirix-core/src/main/java/io/sirix/cache/RecordPageCache.java

The usage of the caches is in: https://github.com/sirixdb/sirix/blob/main/bundles/sirix-core/src/main/java/io/sirix/access/trx/page/NodePageReadOnlyTrx.java (resourceBufferManager).

I'm really curious, but as I switched work (to embedded software engineer), I do not have that much energy left currently, to work a lot on Sirix in my spare time -- but as I spent quite some spare time the last 11 years (with some gaps ;)) it'd be ok to also pay for one or two hours consulting or something like that (for instance analyzing these throughput issue(s) and maybe latency based on this test). I'm pretty confident that the overall architecture is / should be scalable for read-only trxs for instance, as otherwise no locks are used and before checking the cache, "direct" in-memory references are used.

kind regards Johannes

ben-manes commented 2 months ago

I’d probably capture a jfr profile and jstack when this happens if reproducible. Then it might help figure out where the blocking is. If your cache stays small then you might want to give it an initialCapacity to reduce lock collisions within ConcurrentHashMap. The faq has some additional tips.

Is there something you want me to run and diagnose? I’m unclear how to help atm.

JohannesLichtenberger commented 2 months ago

If you like you could run the currently disabled test -- I'd have to put up the close to 4 GB Chicago JSON file somewhere (I can also try to give async profiler another try later on, but I think the visualizations in IntelliJ ultimate are a bit limited). Also it was (maybe?) strange that YourKit didn't show any monitors held somewhere, but maybe it's somehow due to the single threaded scheduler or something else.

I'm using GraalVM (Java 22) currently as it was nearly 30% faster regarding latency /a single trx when traversing the binary JSON.

JohannesLichtenberger commented 2 months ago

https://www.file-upload.net/download-15361902/cityofchicago.json.tar.gz.html

I could also upload the zipped JSON file somewhere else. The decoded file has to be stored in bundles/sirix-core/src/test/resources/json

JohannesLichtenberger commented 2 months ago

Also, locally, I reduced the cache sizes considerably. In LocalDatabase line 125: bufferManagers.put(resourceFile, new BufferManagerImpl(500, 100, 5_000, 50_000, 500, 20));

Well, now I think only one of the trxs runs and finishes.

johannes@luna:~/IdeaProjects/sirix$ time ./gradlew :sirix-core:test --tests io.sirix.service.json.shredder.JsonShredderTest.testChicagoDescendantAxisParallel
Starting a Gradle Daemon, 1 incompatible and 4 stopped Daemons could not be reused, use --status for details

> Configure project :
The 'sonarqube' task depends on compile tasks. This behavior is now deprecated and will be removed in version 5.x. To avoid implicit compilation, set property 'sonar.gradle.skipCompile' to 'true' and make sure your project is compiled, before analysis has started.
The 'sonar' task depends on compile tasks. This behavior is now deprecated and will be removed in version 5.x. To avoid implicit compilation, set property 'sonar.gradle.skipCompile' to 'true' and make sure your project is compiled, before analysis has started.

> Task :sirix-core:test
[0.000s][warning][pagesize] UseLargePages disabled, no large pages configured and available on the system.

WARNING: A JVM TI agent has been loaded dynamically (/home/johannes/Downloads/async-profiler-3.0-linux-x64/bin/../lib/libasyncProfiler.so)
WARNING: If a serviceability tool is in use, please run with -XX:+EnableDynamicAgentLoading to hide this warning
WARNING: Dynamic loading of agents will be disallowed by default in a future release
[22,757s][warning][jni,resolve] Re-registering of platform native method: jdk.internal.misc.Unsafe.park(ZJ)V from code in a different classloader
Profiling started

Deprecated Gradle features were used in this build, making it incompatible with Gradle 9.0.

You can use '--warning-mode all' to show the individual deprecation warnings and determine if they come from your own scripts or plugins.

For more on this, please refer to https://docs.gradle.org/8.8/userguide/command_line_interface.html#sec:command_line_warnings in the Gradle documentation.

BUILD SUCCESSFUL in 1m 37s
5 actionable tasks: 1 executed, 4 up-to-date

real    1m37,892s
user    0m1,676s
sys 0m0,178s
johannes@luna:~/Downloads/async-profiler-3.0-linux-x64/bin$ ./asprof -d 300 -e cpu --alloc 2m --lock 1ms --wall 100ms --cstack dwarf -f two-read-only-trxs-profile.jfr 48294
Profiling for 300 seconds
Process exited

https://github.com/sirixdb/sirix/blob/main/three-read-only-trxs-profile.jfr

JohannesLichtenberger commented 2 months ago

I think this is the write contention mentioned in FAQ, when the cache sizes are small, but even with bigger sizes it's like N read-only TRX then it needs N*the time to finish, but I'm on my phone now

JohannesLichtenberger commented 2 months ago

With all caching relevant stuff commented:

without-caching

With caching:

with-caching

I don't know exactly when the threads will park or the cause.

ben-manes commented 2 months ago

You could try executor(Runnable::run) to avoid any usage of the commonPool(). Just curious since it’s the main difference in your thread counts, but no reason to think it matters.

JohannesLichtenberger commented 2 months ago

It seems that in private void putIntoPageCache(PageReference reference, Page page), I have to use the semantics of a putIfAbsent as otherwise, I guess in the meantime, between reading from the cache and, if not found, reading from the file, another thread may have already put the page into the cache, and then it evicts the old entry with eviction cause "REPLACES." I'm not entirely sure what's going on, but it seems that may do the trick. As you once mentioned, I should probably also invert the dependency. Thus, reading the in-memory page if available, but then from the Cache and if it's not found the cache itself has to do the heavy lifting of fetching the page from durable storage. That said, I'm not sure how to do this currently, without changing too much.

JohannesLichtenberger commented 2 months ago

Oh sorry, I still commented putIntoPageCache locally, so that's not the cause probably. When uncommenting and simply using something as

  default void putIfAbsent(K key, V value) {
    if (get(key) == null) {
      put(key, value);
    }
  }

the problem occurs again...

JohannesLichtenberger commented 2 months ago

At least whenever putting the pages into the page cache the effect is visible. Also adding .executor(Runnable::run) didn't help.

ben-manes commented 2 months ago

Ideally you would load through the cache using cache.get(key, mappingFunction)

JohannesLichtenberger commented 2 months ago

It seems this did the trick...

    if (trxIntentLog == null) {
      assert reference.getLogKey() == Constants.NULL_ID_INT;
      page = resourceBufferManager.getPageCache().get(reference, pageReference -> {
        try {
          return pageReader.read(pageReference, resourceSession.getResourceConfig());
        } catch (final SirixIOException e) {
          throw new IllegalStateException(e);
        }
      });
      if (page != null) {
        reference.setPage(page);
        return page;
      }
    }

Except for the fact that something is still slowing down considerably (all 3 trx finished the DescendantAxis (preorder) traversal in 103s vs. 65 currently with a single trx.

18:13:08.429 [pool-1-thread-2] INFO i.s.s.json.shredder.JsonShredderTest - done [103s]. 18:13:08.429 [pool-1-thread-3] INFO i.s.s.json.shredder.JsonShredderTest - done [103s]. 18:13:08.429 [pool-1-thread-3] INFO i.s.s.json.shredder.JsonShredderTest - start 18:13:08.429 [pool-1-thread-1] INFO i.s.s.json.shredder.JsonShredderTest - done [103s].

    if (trxIntentLog == null) {
      assert reference.getLogKey() == Constants.NULL_ID_INT;
      page = resourceBufferManager.getPageCache().get(reference, pageReference -> {
        try {
          return pageReader.read(pageReference, resourceSession.getResourceConfig());
        } catch (final SirixIOException e) {
          throw new IllegalStateException(e);
        }
      });
      if (page != null) {
        reference.setPage(page);
        return page;
      }
    }

However, as I'm trying to learn something, it was more or less trial & error instead of clearly showing via a Profiler where the synchronization issue was :-/

Also I'm not sure if there are low hanging fruits to improve both latency and throughput of Sirix :-)

ben-manes commented 2 months ago

yeah, profiling is hit-or-miss unfortunately. When I profile it only gets to AbstractNodeReadOnlyTrx.getStructuralNode() as the cause, but that seems like sampling noise.

ben-manes commented 2 months ago

without data its hard to pinpoint as just random guesses. You could try disabling expiration to see if its the problem. If it is not using the userspace clock source then it will be much slower due to system calls.

JohannesLichtenberger commented 2 months ago

Yes, that's sample noise. I'm getting a "good"/plausible CPU profile at least when my Laptop is plugged in :-) will have to check wall clock time again, though.

What do you mean regarding the data and the clock source? The data I'm currently using is always the shredded JSON file (needs to be imported once, for instance using this test: https://github.com/sirixdb/sirix/blob/d940acd2d6add63a2d801e4d5d506e1d4a85eebe/bundles/sirix-core/src/test/java/io/sirix/service/json/shredder/JsonShredderTest.java#L198. Then you have to remove the setup function or comment the deletion: https://github.com/sirixdb/sirix/blob/d940acd2d6add63a2d801e4d5d506e1d4a85eebe/bundles/sirix-core/src/test/java/io/sirix/service/json/shredder/JsonShredderTest.java#L61

Then you can execute this test for profiling...: https://github.com/sirixdb/sirix/blob/d940acd2d6add63a2d801e4d5d506e1d4a85eebe/bundles/sirix-core/src/test/java/io/sirix/service/json/shredder/JsonShredderTest.java#L78

Sorry and thanks for all the help :-)

ben-manes commented 2 months ago

I mean that the obtaining the current time might not be a userland call, which makes it very expensive. That was the case a few years ago (description) by default on AWS, and I believe is still the case on Windows / Mac. On those using System.currentTimeMillis() was significantly faster than System.nanoTime(), but I have not followed this topic in a long time. Even though Caffeine does expiration in O(1) time, it is an inherently more expensive policy due to validation checks so it might be interesting to see the results without it enabled.

JohannesLichtenberger commented 2 months ago

Timing based expiration shouldn't even happen, due to 5 minutes and the test runs faster I hope, but I should get rid of the policy altogether, I guess. The Caffeine caches should be used as a global buffer pool for all transactions, if the Page isn't set in PageReference. I think this should avoid the more costly buffer pool access in a lot of cases (hopefully).

Oh ok, but in any case, the timings are not very sensitive and I think it's called 6 times in the test. However we store the system time everytime the trx commits in the first place.

ben-manes commented 2 months ago

I was benchmarking timing for an Apache Pulsar issue, where their benchmarks appear to be using the kernel system call for the clock source. If userland then the performance is much better, so I know that is often a surprising bottleneck as depends on the OS, virtualization, etc. Simulating Linux's vDSO mapped call on my macbook (which does the slow system call), the throughput went from 6.5M/s to 121M/s. That might not be your problem, but an important detail to be aware of for latency sensitive systems that make frequent calls to the clock source.

ben-manes commented 2 months ago

I've been unable to get a test run to a state to understand your problems.

When I disable expiration in all of your caches, as it sounds unnecessary, then the test completes after 20 minutes. The M3 Max laptop is pinned at 100% cpu, where the test method's threads are all runnable and busy within AbstractAxis. All of the parked threads are idle thread pools and not blocked on anything within Caffeine or Sirix's code.

If I leave expiration on it appears similar, but I observe some AbstractAxis operations within NodePageReadOnlyTrx doing serialization work, such as byte copying and decompression. This also ran for 20 minutes with full cpu utilization.

Reviewing the code and discussion, the only thing that stands out is the PageReference behavior with the cache stampedes. If that is doing a racy get-load-put that results in a replace, then the key.page is set to null prematurely. The key might still be in the cache (e.g. if replaced) but not unlinked to the page value. It looks like that could result in duplicate pages being loaded and it no longer having the same instance as the cached page value. This seems to be papered over by the loads, but could result in excessive memory usage and additional GC overhead.

None of the caches are exporting metrics and likely more instrumentation would hint as to the actual throughput and behavior. As an outsider, I don't know what to look for to know what is good or bad performance. Sorry that I can't be of more help.

JohannesLichtenberger commented 2 months ago

I've updated to 5 threads / 5 trxs yesterday and again it seemed like 5x time needed somehow. I'm not sure, but I also have to update the RecordPageCache with loading through the cache. But otherwise I have no idea what happens.

JohannesLichtenberger commented 2 months ago

Running the test with a single trx, this one: https://github.com/sirixdb/sirix/blob/d940acd2d6add63a2d801e4d5d506e1d4a85eebe/bundles/sirix-core/src/test/java/io/sirix/service/json/shredder/JsonShredderTest.java#L143

Runtime should be close to the case with N read-only trxs IMHO. I'm not even sure whom to ask for help, as it'd be really ok for me to spend some money (albeit a bit limited of course, as it's only my hobby project)...

JohannesLichtenberger commented 2 months ago

BTW: what are your results with the single read trx test?

ben-manes commented 2 months ago

huh? I have no idea what results even mean. All I know is to run a test method, it takes 20 minutes with high cpu, and supposedly that it should be better. You haven’t defined the problem, captured metrics, or given something to analyze to experiment with improvements. I don’t know the code base to answer about further results.

JohannesLichtenberger commented 2 months ago

You can change the number of Threads basically here: https://github.com/sirixdb/sirix/blob/d940acd2d6add63a2d801e4d5d506e1d4a85eebe/bundles/sirix-core/src/test/java/io/sirix/service/json/shredder/JsonShredderTest.java#L54

That is also the number of read-only trxs created.

So, it's basically running

https://github.com/sirixdb/sirix/blob/d940acd2d6add63a2d801e4d5d506e1d4a85eebe/bundles/sirix-core/src/test/java/io/sirix/service/json/shredder/JsonShredderTest.java#L78

Vs

https://github.com/sirixdb/sirix/blob/d940acd2d6add63a2d801e4d5d506e1d4a85eebe/bundles/sirix-core/src/test/java/io/sirix/service/json/shredder/JsonShredderTest.java#L143

One trxs or N trxs in parallel scanning the whole resource.

You could for instance change the number of cores for instance to indirectly check the traversal of the same number of transactions.

It's almost as worse as serializing the transactions and executing them one after the other. Though, I'm not sure if that's related to Caffeine, that's why I said that I don't know whom to ask, sorry. Really appreciate your help and that you run the tests yourself :-)

Regarding latency of the single trx I'm not sure if it could be improved. Of course my PCIe4 SSD should be faster, but I think that's attributed to decompression of the pages, maybe.

I think we could add querying stats from the Caffeine caches from time to time/ logging the stats? Or maybe simply through debugging?

JohannesLichtenberger commented 2 months ago

locks

I've committed/pushed some minor changes. Now, I'm getting a lot of locks involved. For read-only transactions as in the test(s), I think now I'm always populating the Caches through put(key, Function), at least the PageCache and the RecordPageCache. As one thread always holds the lock and the others are waiting, I suspect that could be the issue, but regarding the time spent, I'm not sure. It may only add up to a couple of seconds in total, but I can't see any other locks/monitors held.

That said they add up over time (after 2,5minutes roughly):

locks-held

JohannesLichtenberger commented 2 months ago

threads

Well, regarding the overall time, it still seems to be only a (short) fraction of the time, that the threads are blocked (the upper 5 threads are the 5 trx threads and a red rectangle marks blocking; the red flames mark that the threads are doing something / CPU time)

ben-manes commented 2 months ago

For putIfAbsent you can use the asMap() view which will be atomic and a bit faster, since it avoids two calls.

When I profile then the dominant costs are deserialization and node traversal / movement.

Caffeine had the longest blocking wait of 23ms in P=3 and 49ms in P=14 for the Page load. It doesn't appear to be contention and just an expensive operation loading that it must wait for and that heavy load causes longer waits due to a lack of resources. If you think its lock collisions on unrelated entries then you could use the future trick described in the FAQ to decouple the computation. That has the benefit of being virtual thread friendly so blocking I/O and locks don't add thread context switch costs, but since its able to maximize the cpu that likely won't be a further benefit.

Avoiding the cache stampede with the latest updates reduced the P=14 runtime by 2.5 minutes, so I think that was a significant win. The GC behavior seems healthy so reducing allocations might not have much impact. I don't know the node traversal / rebalancing algorithms, but it seems like optimizing that would have the largest benefit and there are various tree variants for those purposes.

testChicagoDescendantAxis()

profile.jfr.zip

1
Screenshot 2024-07-21 at 10 01 17 AM

testChicagoDescendantAxisParallel() - NUMBER_OF_PROCESSORS = 3

profileP3.jfr.zip

2
Screenshot 2024-07-21 at 10 04 45 AM
3
Screenshot 2024-07-21 at 10 06 58 AM
4
Screenshot 2024-07-21 at 10 11 29 AM

testChicagoDescendantAxisParallel() - NUMBER_OF_PROCESSORS = 14

profileP14.jfr.xz.zip

5
Screenshot 2024-07-21 at 10 21 04 AM
6
Screenshot 2024-07-21 at 10 23 07 AM
7
Screenshot 2024-07-21 at 10 22 22 AM
8
Screenshot 2024-07-21 at 10 27 54 AM
JohannesLichtenberger commented 2 months ago

The basic tree is a a simple trie, and for monotonically increasing IDs I think it's a very nice structure as you can precompute the levels basically via simple bit shifting:

https://github.com/sirixdb/sirix/blob/37043427b7a9cb4dc36815d243864491858a95ea/bundles/sirix-core/src/main/java/io/sirix/access/trx/page/NodePageReadOnlyTrx.java#L714

That said I've added BitmapReferencePages for the inner pages of the trie to reduce space consumption for the rightmost pages.

The heavy lifting may be this method: https://github.com/sirixdb/sirix/blob/37043427b7a9cb4dc36815d243864491858a95ea/bundles/sirix-core/src/main/java/io/sirix/access/trx/page/NodePageReadOnlyTrx.java#L577

It has to read up to an upper threshold page fragments in parallel for the trie leaf pages from disk (hopefully a PCIe SSD).

Afterwards the full page is reconstructed with sliding snapshot versioning over here: https://github.com/sirixdb/sirix/blob/37043427b7a9cb4dc36815d243864491858a95ea/bundles/sirix-core/src/main/java/io/sirix/settings/VersioningType.java#L428

Maybe it would make sense to deserialize all records at once in a page and not on demand as in

https://github.com/sirixdb/sirix/blob/37043427b7a9cb4dc36815d243864491858a95ea/bundles/sirix-core/src/main/java/io/sirix/access/trx/page/NodePageReadOnlyTrx.java#L281

But it depends of course as indexed nodes would not benefit from this.

ben-manes commented 2 months ago

The tree seems to be highly megamorphic with many subtypes and forwarding chains. This can be problematic for compiler inlining and other optimizations. Sometimes lack of inlining can be a large performance problem where a frequently called but inexpensive method is dominant on the profile because the inliner gave up and the cost exploded. I recall having that happen at a prior job with a custom Preconditions class for assertions that funneled all into common method, but the method delegate chaining between helpers them surprisingly costly even though they did no work.

That might not be the dominant cost, just that abstraction flexibility may benefit architectural performance at the cost of low-level performance. Hence, in Caffeine internally things are a bit brittle at the lowest level (e.g. the TimerWheel), more system than per-thread at the architectural level (e.g. ring buffers with maintenance), and hidden away through interface abstractions. It could be that the trie is too general purpose for your actual needs.

There are a lot of different tree/trie structures, e.g. those that colocate multiple values onto a single node to optimize traversal. That's not something I've spent time on to offer any advise and of course is a pretty fundamental change.

I always liked the motto "make the common case fast". If certain operations are rare its okay to make them more costly. Similarly, if an operation is already much faster than needed then its okay to penalize it to balance the performance elsewhere. These are all tradeoffs to find the sweet spot.

JohannesLichtenberger commented 2 months ago

Thanks for the explanation.

Regarding the idea with the trie I think it's really good. The IDs assigned to nodes are sequential and monotonically increasing (an AtomicLong). First 1024 nodes are stored in a leaf page (KeyValueLeafPage, then an inner page IndirectPage is added on top to reference 1023 more KeyValueLeafPages (basically in the easiest case all array indices are full, thus the IndirectPage encapsulates a FullReferencesPage). Everytime we have to address more nodes a new IndirectPage is added to the top of the trie (meaning next time after 1024×1024 nodes). So basically the which PageReference to dereference is a simple bit shifting operation, but maybe I have to remove the complexity with BitmapReferencesPages or when not all array indices are set with PageReferences to other IndirectPages or KeyValueLeafPages

Thus an IndirectPage consists of one of these 3 delegates, but that might have introduced an unnecessary indirection cost...

https://github.com/sirixdb/sirix/tree/main/bundles/sirix-core/src/main/java/io/sirix/page/delegates

I think this trie with wide branching inner pages for IDs which are simply 0,1,2,...,N for the nodes should be ideal and the indices can simply be computed instead of having to do costly searches in the pages for a specific reference or node.

The overall architecture of splitting the JSON file into fine granular nodes and the persistent trie data structure is described here if you're curious on a higher level: https://sirix.io/docs/concepts.html

That's why I always thought it should be faster as for instance traversing a B+ tree or an LSM tree... usually the neigbour nodes and children are also placed on the same page if not heavily inserted / deleted. At least in our tests the nodes are only once inserted and thus, the first 1024 nodes are stored in the first KeyValueLeafPage, the next 1024 nodes in the next page... (regarding a preorder traversal/parsing of the JSON file).

The persistent structure is shown here: https://raw.githubusercontent.com/sirixdb/sirixdb.github.io/master/images/sirix-revisions.png

JohannesLichtenberger commented 2 months ago

@ben-manes I guess it's ok to fetch something (in a lambda / a function, which is used to get the value in case it's not in the cache) from another Caffeine cache? So, nested cache fetches...

nested-caches

ben-manes commented 2 months ago

Nesting is fine if to a different cache instance. If the call comes back to the same cache instance, e.g. recursive load, then that would fail as unsupported by ConcurrentHashMap. Those types of cases is when decoupling the computation from the hash table's locking is beneficial, as described in the FAQ.