 deepakjois
commented
7 years ago
deepakjois
commented
7 years ago @hyc Maybe you have some insights regarding this?
Closed deepakjois closed 7 years ago
deepakjois
commented
7 years ago @hyc Maybe you have some insights regarding this?
deepakjois
commented
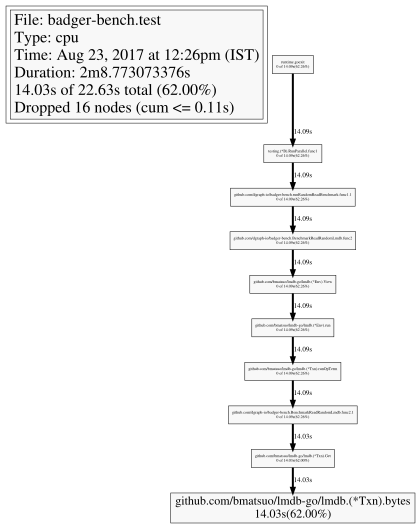
7 years ago Here is a visualization from another cpu trace, for clarity.
 hyc
commented
7 years ago
hyc
commented
7 years ago Sorry, no idea. Go is not my specialty, and I don't know what's going on inside lmdb-go.
 xlab
commented
7 years ago
xlab
commented
7 years ago @deepakjois Hi, thanks for the report and this good bench suite for all three KV stores, I find it very useful!
I just finished evaluating the benchmarks and things are looking to be very normal and familiar from my experience with BoltDB and LMDB. For my experiments I used an Amazon EC2 instance of type m4.4xlarge (16 vCPU, 64 GB RAM) and provisioned IO SSD disk of 2TB capacity (20,000 IOPS guaranteed). The disk was mounted with ext4 defaults,noatime,nobarrier.
OS:
Linux 4.9.38-16.35.amzn1.x86_64 #1 SMP Sat Aug 5 01:39:35 UTC 2017 x86_64 x86_64 x86_64 GNU/LinuxFirst, I'd like to note that the population performance of BoltDB and LMDB are still uncomparable, e.g. this is LMDB:
[0332] Write key rate per minute: 805.00K. Total:   4.94M
[0333] Write key rate per minute: 767.00K. Total:   4.95M
[0334] Write key rate per minute: 775.00K. Total:   4.96M
[0335] Write key rate per minute: 780.00K. Total:   4.96M
[0336] Write key rate per minute: 744.00K. Total:   4.97M
[0337] Write key rate per minute: 752.00K. Total:   4.98M
[0338] Write key rate per minute: 760.00K. Total:   4.99M
[0339] Write key rate per minute: 730.00K. Total:   5.00M
[0340] Write key rate per minute: 735.00K. Total:   5.00M
closing lmdb

WROTE 5004000 KEYS
But BoltDB declines very fast and I barely had patience to wait until all 5M keys have been written:
[6834] Write key rate per minute:  25.00K. Total:   5.00M
[6835] Write key rate per minute:  26.00K. Total:   5.00M
[6836] Write key rate per minute:  26.00K. Total:   5.00M
[6837] Write key rate per minute:  26.00K. Total:   5.00M
[6838] Write key rate per minute:  26.00K. Total:   5.00M
[6839] Write key rate per minute:  27.00K. Total:   5.00M
[6840] Write key rate per minute:  25.00K. Total:   5.00M
[6841] Write key rate per minute:  25.00K. Total:   5.00M
closing bolt

WROTE 5004000 KEYS@deepakjois
Secondly, both LMDB and BoltDB are highly dependent on the OS disk cache, i.e. after the file was populated it almost entirely sits in the RAM just in case, also if it was completely read, it will still sit in the RAM. The difference you're getting in benchmarks is coming from the fact that some data got into RAM already and is being read from there. And another effect is that when some data is in RAM already, then more free time remains for benchmark to read additional values from the disk: in your run LMDB obviously was reading values from the disk (only 10000 read in the timeframe), and BoltDB got 100000, most of them probably from the RAM, and the rest from the disk.
Both LMDB and BoltDB are read-optimized, and the timings are very predictable, given the modern hardware and the same CPU frequency. If a read takes 1-2µs, it definitely comes from a RAM cache, if a read takes 130-230µs it definitely comes from the SSD itself. In your case BoltDB got mixed reads, so it was 17µs. To make clean experiments, you can use the following methodology.
xlab
commented
7 years ago @deepakjois
I. State with no caches preset
To get into this state you must run:
echo 3 | sudo tee /proc/sys/vm/drop_caches
sudo blockdev --flushbufs /dev/sdX
Let's run the benchmarks again, but don't forget to use -benchtime 5s to avoid fluctuations. By looking at your benchmarking code it seems that reads are not guaranteed to be unique, so fluctuations may happen if some keys are getting read twice or more. But most reads should hit the SSD directly.
a) BoltDB
$ go test -v --bench BenchmarkReadRandomBolt --keys_mil 5 --valsz 16384 --dir /media/db/store -benchtime 5s
goos: linux
goarch: amd64
pkg: github.com/dgraph-io/badger-bench
BenchmarkReadRandomBolt/read-randombolt-16            100000        116133 ns/op
--- BENCH: BenchmarkReadRandomBolt
    bench_test.go:104: bolt: 63184 keys had valid values.
    bench_test.go:105: bolt: 36816 keys had no values
    bench_test.go:106: bolt: 0 keys had errors
    bench_test.go:107: bolt: 100000 total keys looked at
    bench_test.go:108: bolt: hit rate : 0.63
PASS
ok      github.com/dgraph-io/badger-bench   13.236s
b) LMDB
$ go test -v --bench BenchmarkReadRandomLmdb --keys_mil 5 --valsz 16384 --dir /media/db/store -benchtime 5s
goos: linux
goarch: amd64
pkg: github.com/dgraph-io/badger-bench
BenchmarkReadRandomLmdb/read-randomlmdb-16             20000        351960 ns/op
--- BENCH: BenchmarkReadRandomLmdb
    bench_test.go:104: lmdb: 12651 keys had valid values.
    bench_test.go:105: lmdb: 7349 keys had no values
    bench_test.go:106: lmdb: 0 keys had errors
    bench_test.go:107: lmdb: 20000 total keys looked at
    bench_test.go:108: lmdb: hit rate : 0.63
PASS
ok      github.com/dgraph-io/badger-bench   10.596s
Yes, there is still a difference, but nothing extraordinary. Actually it may depend on the value size, as I know BoltDB's performance is not stable depending on the value size. LMDB performance is more stable and with another conditions the resulting figures could be swapped.
II. State with everything in RAM cache
This is achievable if you run benchmarks soon after populating the store, but another way to get everything into RAM is to read all values. To do that let's run the test at least 2 minutes with -benchtime 120s to let all keys be read at least once. (I suggest you to change the benchmark that will make reads unique, as there is no guarantee that running even for 5 minutes will read all 5M keys at least once).
a) BoltDB (right after accessing all keys)
$ go test -v --bench BenchmarkReadRandomBolt --keys_mil 5 --valsz 16384 --dir /media/db/store -benchtime 5s
goos: linux
goarch: amd64
pkg: github.com/dgraph-io/badger-bench
BenchmarkReadRandomBolt/read-randombolt-16          20000000           426 ns/op
--- BENCH: BenchmarkReadRandomBolt
    bench_test.go:104: bolt: 12655289 keys had valid values.
    bench_test.go:105: bolt: 7344711 keys had no values
    bench_test.go:106: bolt: 0 keys had errors
    bench_test.go:107: bolt: 20000000 total keys looked at
    bench_test.go:108: bolt: hit rate : 0.63
PASS
ok      github.com/dgraph-io/badger-bench   9.500s
b) LMDB (right after accessing all keys)
$ go test -v --bench BenchmarkReadRandomLmdb --keys_mil 5 --valsz 16384 --dir /media/db/store -benchtime 5s
goos: linux
goarch: amd64
pkg: github.com/dgraph-io/badger-bench
BenchmarkReadRandomLmdb/read-randomlmdb-16          20000000           385 ns/op
--- BENCH: BenchmarkReadRandomLmdb
    bench_test.go:104: lmdb: 12648566 keys had valid values.
    bench_test.go:105: lmdb: 7351434 keys had no values
    bench_test.go:106: lmdb: 0 keys had errors
    bench_test.go:107: lmdb: 20000000 total keys looked at
    bench_test.go:108: lmdb: hit rate : 0.63
PASS
ok      github.com/dgraph-io/badger-bench   10.925s
All other results you would get from the benchmarks will be a mix between RAM and direct SSD access, when a part of the data has been previously read.
Good luck :)
xlab
commented
7 years ago Meanwhile, Badger cold-starts with 46937 ns/op on the same dataset, but it takes much more time to get cached properly, after warmup the reads were taking 12616 ns/op so I had to do a second warmup, after that I achieved no less than 863 ns/op.
hyc
commented
7 years ago @xlab thanks for taking the time to illustrate what's going on so extensively. Your results match what I've seen here. Under equal conditions nothing else gets anywhere close to LMDB's read performance.
deepakjois
commented
7 years ago @xlab Thanks for your comments regarding the bechmarking suite, and also for taking the time to run the benchmarks. I really appreciate it.
I just want to clarify that my intention wasn’t to challenge any claims about LMDB’s performance. In fact I was a bit surprised at the results I got, and I was looking for any possible errors in my setup which might be causing that. We are still in the middle of doing comprehensive benchmarking, and hope to publish a blog about it soon.
The results that you report are more along expected lines. However, there is one very important difference between your setup and ours. Your setup uses 64GB of RAM. We are running benchmarks here on a machine with 16GB of RAM.
This is a deliberate choice. Some of our use cases for Badger (in Dgraph) involve store sizes which are larger than the RAM available on the machine. In this case, BoltDB store size was 55GB and LMDB was 61GB.
Keeping that in mind, I took your suggestion of clearing the caches and ran the benchmark again. I am just focusing on random read performance below. I also set the -benchtime to be 5s. I have run benchmarks with -benchtime 3m (which is our standard setup) as well and the results are not very different.
$ echo 3 | sudo tee /proc/sys/vm/drop_caches
$ sudo blockdev --flushbufs  /dev/nvme0n1

$ go test -v --bench BenchmarkReadRandomBolt --keys_mil 5 --valsz 16384 --dir /mnt/data/16kb -benchtime 5s
BenchmarkReadRandomBolt/read-randombolt-128               300000             20978 ns/op
--- BENCH: BenchmarkReadRandomBolt
        bench_test.go:104: bolt: 189566 keys had valid values.
        bench_test.go:105: bolt: 110434 keys had no values
        bench_test.go:106: bolt: 0 keys had errors
        bench_test.go:107: bolt: 300000 total keys looked at
        bench_test.go:108: bolt: hit rate : 0.63
PASS
ok      github.com/dgraph-io/badger-bench       6.842s

$ echo 3 | sudo tee /proc/sys/vm/drop_caches
$ sudo blockdev --flushbufs  /dev/nvme0n1

$ go test -v --bench BenchmarkReadRandomLmdb --keys_mil 5 --valsz 16384 --dir /mnt/data/16kb -benchtime 5s
BenchmarkReadRandomLmdb/read-randomlmdb-128                30000            196923 ns/op
--- BENCH: BenchmarkReadRandomLmdb
        bench_test.go:104: lmdb: 18801 keys had valid values.-cpuprofile lmdb.out
        bench_test.go:105: lmdb: 11199 keys had no values
        bench_test.go:106: lmdb: 0 keys had errors
        bench_test.go:107: lmdb: 30000 total keys looked at
        bench_test.go:108: lmdb: hit rate : 0.63
PASS
ok      github.com/dgraph-io/badger-bench       8.370s
As you can see, LMDB is still reporting much higher timings. I still havent been able to figure out why there is such a big difference. My initial suspicion was that it is the lmdb-go bindings which may be the problem, which is why I filed an issue here.
Any insight into this would be useful, unless you believe this is along expected lines.
hyc
commented
7 years ago Oh, when your data set is larger than RAM you need to use NoReadahead on the environment. By default the kernel pages in 16 pages on every 1-page access, and when the data set is so large, the extra 15 pages usually means some other useful data gets evicted from FS cache.
hyc
commented
7 years ago Hm, with txn.RawRead = true and with lmdb.NoReadahead set, I got these results:
[hyc@gamba badger-bench]$ go test --bench BenchmarkReadRandomBadger --valsz 16000 --keys_mil 2 --dir /mnt/data/b1000 --timeout 10m --benchtime 3m
/mnt/data/b1000/badger
BenchmarkReadRandomBadger/read-random-badger-4           5000000         40377 ns/op
PASS
ok      github.com/dgraph-io/badger-bench   252.981s
[hyc@gamba badger-bench]$ go test --bench BenchmarkReadRandomRocks --valsz 16000 --keys_mil 2 --dir /mnt/data/b1000 --timeout 10m --benchtime 3m
BenchmarkReadRandomRocks/read-random-rocks-4             1000000        338936 ns/op
PASS
ok      github.com/dgraph-io/badger-bench   460.359s
[hyc@gamba badger-bench]$ go test --bench BenchmarkReadRandomLmdb --valsz 16000 --keys_mil 2 --dir /mnt/data/b1000 --timeout 10m --benchtime 3m
BenchmarkReadRandomLmdb/read-random-lmdb-4          200000000         1478 ns/op
PASS
ok      github.com/dgraph-io/badger-bench   454.398s
2M keys of 16000 bytes each, so 32GB on a machine with 16GB RAM. Note that LMDB currently has a 16byte page header that occupies data space, so if you use a valuesize of 16384 it will actually take 5 4096byte pages not 4. In LMDB 1.0 we'll be removing the page header from overflow pages.
deepakjois
commented
7 years ago Thank you @hyc. Setting lmdb.NoReadahead does make a huge a difference.
$ go test  -v --bench BenchmarkReadRandomLmdb --keys_mil 5 --valsz 16384 --dir "/mnt/data/16kb" --timeout 10m --benchtime 5s
BenchmarkReadRandomLmdb/read-randomlmdb-128              1000000              6777 ns/op
--- BENCH: BenchmarkReadRandomLmdb
        bench_test.go:104: lmdb: 631893 keys had valid values.
        bench_test.go:105: lmdb: 368107 keys had no values
        bench_test.go:106: lmdb: 0 keys had errors
        bench_test.go:107: lmdb: 1000000 total keys looked at
        bench_test.go:108: lmdb: hit rate : 0.63
PASS
ok      github.com/dgraph-io/badger-bench       11.005s

$ go test -v --bench BenchmarkReadRandomBolt --keys_mil 5 --valsz 16384 --dir /mnt/data/16kb -benchtime 5s
BenchmarkReadRandomBolt/read-randombolt-128               300000             21025 ns/op
--- BENCH: BenchmarkReadRandomBolt
        bench_test.go:104: bolt: 189816 keys had valid values.
        bench_test.go:105: bolt: 110184 keys had no values
        bench_test.go:106: bolt: 0 keys had errors
        bench_test.go:107: bolt: 300000 total keys looked at
        bench_test.go:108: bolt: hit rate : 0.63
PASS
ok      github.com/dgraph-io/badger-bench       6.842s
Once again, thanks for taking the time to dig into this.
deepakjois
commented
7 years ago I will close this issue now, because my core concern is resolved.
But before that I just wanted to point out that setting the lmdb.NoReadahead flag slows down iteration under the same setup:
w/ lmdb.NoReadahead set:
$ go test -v --bench BenchmarkIterateLmdb --keys_mil 5 --valsz 16384 --dir "/mnt/data/16kb" --timeout 60m
....................BenchmarkIterateLmdb/lmdb-iterate-128                      1
        2745882237254 ns/op
--- BENCH: BenchmarkIterateLmdb/lmdb-iterate-128
        bench_test.go:317: [0] Counted 2000000 keys
PASS
ok      github.com/dgraph-io/badger-bench       2746.396s
without lmdb.NoReadahead:
$ go test -v --bench BenchmarkIterateLmdb --keys_mil 5 --valsz 16384 --dir "/mnt/data/16kb" --timeout 60m
....................BenchmarkIterateLmdb/lmdb-iterate-128                      1
        625660872083 ns/op
--- BENCH: BenchmarkIterateLmdb/lmdb-iterate-128
        bench_test.go:321: [0] Counted 2000000 keys
PASS
ok      github.com/dgraph-io/badger-bench       626.069s
So, in order to achieve the best possible results for LMDB in all cases, I tweaked the benchmark code to conditionally set the flag based on the type of benchmark being run: https://github.com/dgraph-io/badger-bench/commit/e33adc49f3c7b0e5f917ced8a8706cd1844a5b52
 manishrjain
commented
7 years ago
manishrjain
commented
7 years ago So, in order to achieve the best possible results for LMDB in all cases, I tweaked the benchmark code to conditionally set the flag based on the type of benchmark being run.
Don't think that's the right approach. In a real world system, once you open a KV store with some settings, that's it. All the lookups and iterations happen for the same settings, typically concurrently.
xlab
commented
7 years ago @manishrjain I guess it's under the same Noreadahead settings for LMDB all benchmarks now. N.B. It should be possible to know beforehand if the data set is larger than RAM
I am benchmarking lmdb-go, BoltDB and Badger, using Go benchmarking tools.
In the setup that I have, BoltDB seems to be outperforming lmdb-go by at least an order of magnitude for doing random reads from the key value store. This is a bit surprising and I am trying to investigate why that is the case.
I did some CPU profiling and I noticed this:
the program spends close to 50% of the time in
lmdb.(*Txn).bytes(from here). Is this expected? Can it be improved?Here is the benchmarking code (view in context):
The code inside the loop
pb.Next {…}is called multiple times and an average calculated. Here are the results for LMDB and Bolt in a simple run:Bolt comes in at
17122 ns/opwhich is a lot faster than lmdb-go’s129638 ns/opAdditional Details
Benchmarks are being performed on a dedicted i3.large instance from Amazon AWS, which provides 450GB NVMe SSD storage, 2 virtual cores along with 15.25GB RAM.
Please ask if you require any other details about the benchmarking setup.