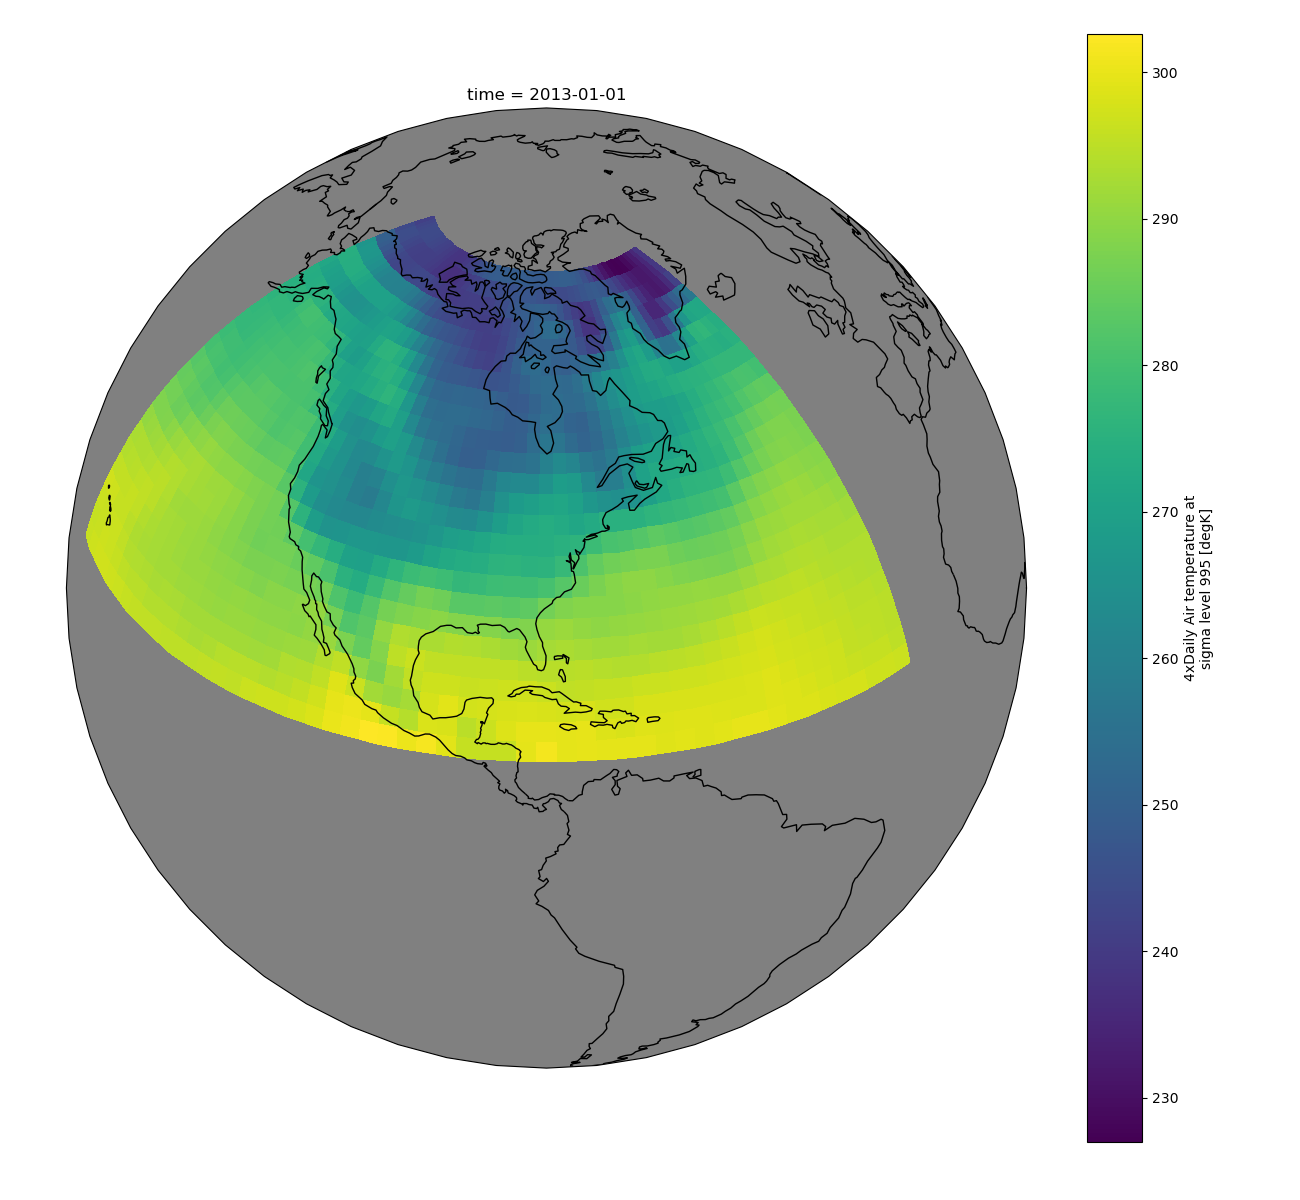
So I've been doing some reading, and I think we should strive to emulate something like this example from the xarray documentation, which uses cartopy to project data onto a globe, then plots it with matplotlib:
import cartopy.crs as ccrs

air = xr.tutorial.open_dataset('air_temperature').air

ax = plt.axes(projection=ccrs.Orthographic(-80, 35))

air.isel(time=0).plot.contourf(ax=ax, transform=ccrs.PlateCarree());

ax.set_global(); ax.coastlines();
There are several advantages of this approach:
-
The projection is passed to matplotlib in the way the matplotlib developers intended, no hacks needed.
-
There is a clear way to implement and specify common projections, e.g.
ax = plt.axes(projection="poloidal_slice")` -
The projection and axes are implemented by a completely separate module from the data handling. xarray is not actually required here.
-
If people want to add new projections then they just add to that module. Different geometries could be handled in a number of ways, one method might look like:
from cartomak.geometries import axisymmetric as cga

ax = plt.axes(projection=cga.PoloidalSlice())`
Also if you just want to plot your raw data on a rectangular grid then you simply don't supply any projection and you'll get a rectangular plot as normal.
-
Both the projection and the transform can take arguments. Although the shape of the Earth doesn't vary, the shape of our plasma does, so being able to alter the transformation based on our data (e.g.
grid.ncfile,geqdskfile...) is important. -
The above example adds coastlines to the globe - we could use a similar method to add separatrices:
ax.separatrices()Adding vessel wall positions would be more complex but possible using an approach like this, e.g.
import cartomak.feature as ctf

ax.add_feature(ctf.VESSEL, machine='MAST')
This could possibly take from existing libraries which can read and plot vessel geometries in matplotlib (@nick-walkden how does pyEquilibrium do it?)
-
The cartopy model doesn't tie you in to using matplotlib. They provide matplotlib compatibility through the projection classes but the underlying transforms can be used with other plotting libraries - here are some examples of cartopy being used with bokeh instead.
-
I'm pretty sure this should be compatible with animating the plots into gifs using animatplot.
-
I tagged this as requiring BOUT changes, but I'm not sure it does. The dataset you plot will need xarray
coordsadded, and these will have to match some standard forms (corresponding to different geometries) in order to be interpreted. However I think this could be done entirely by BOUT-module-specific post-processing code in python, e.g. a side-effect ofopen_stormdataset(which inherits fromxbout.open_boutdataset) is to calculate and add the coordinates['radial', 'pol', 'tor'].
So basically I think that eventually xBOUT should have a module (or maybe it could be standalone project...) which is basically cartopy for tokamaks (cartomak??)
@ZedThree @d7919 @bendudson @JosephThomasParker @johnomotani thoughts?
Once real-space coordinates are included, we can implement tokamak/BOUT-specific plotting methods.
For example we could make a method
da.bout.plot_poloidal_slice().Not sure whether xarray's built-in handling of plotting with non-uniform coordinates would be sufficient, or whether it would be harder than that.
Someone has almost certainly done this already, it might be in BOUT's
pylib(boutdata.pol_slice()andboututils.plotpolslice()would certainly be useful) or maybe even in OMFIT? Could again have crossover with PlasmaPy?If we end up reimplementing this then might want to look at the internals of cartopy.