 bsmithio
commented
10 months ago
bsmithio
commented
10 months ago I have updated various components on here and even tested these with a VM. I believe these updates should resolve your issue.
Closed sticky99 closed 10 months ago
bsmithio
commented
10 months ago I have updated various components on here and even tested these with a VM. I believe these updates should resolve your issue.
 sticky99
commented
10 months ago
sticky99
commented
10 months ago So I'm not sure if I'm doing this right. I just deleted the stack via portainer, then again via portainer created a new stack using the new docker compose provided. But I'm still seeing the same issue. Netstat doesn't show port 9200 or 9300 as being open, I cannot connect to either port via a browser, and in Grafana it still sees elasticsearch as a bad gateway.
Tried it a second time via deleting the stack again, then deleting the images so they needed to be redownloaded. I left the volumes as is. Then recreated the stack again via the new docker compose, but same result as before.
So do I need to delete the volumes also? Or is there any additional steps I'm missing?
sticky99
commented
10 months ago Just tried this on a different unused system with no other containers other than portainer agent and watchtower. Created the stack via portainer using the docker compose, but I didn't do any configuration of Influxdb or on the Opnsense firewall. But while I still see the ports 9200 and 9300 listed via a 'docker ps -a' for elasticsearch, neither show up on a 'netstat -an' and I can't connect via a browser.
Both systems have the same OS on them (Endeavour). If I've time over the weekend, I might be able to spin up another device with a different OS to see if that makes any difference.
bsmithio
commented
10 months ago So it is normal for you to not be able to access elasticsearch via 9200 or 9300 or even see it in netstat as it doesn't need to be exposed like InfluxDB or Graylog. Grafana should be able to access it since it is in the same docker network though.
One thing we can try is to shell into the Grafana container and see if you can wget the elasticsearch URL.
sudo docker exec -it grafana bash
[Inside the container]
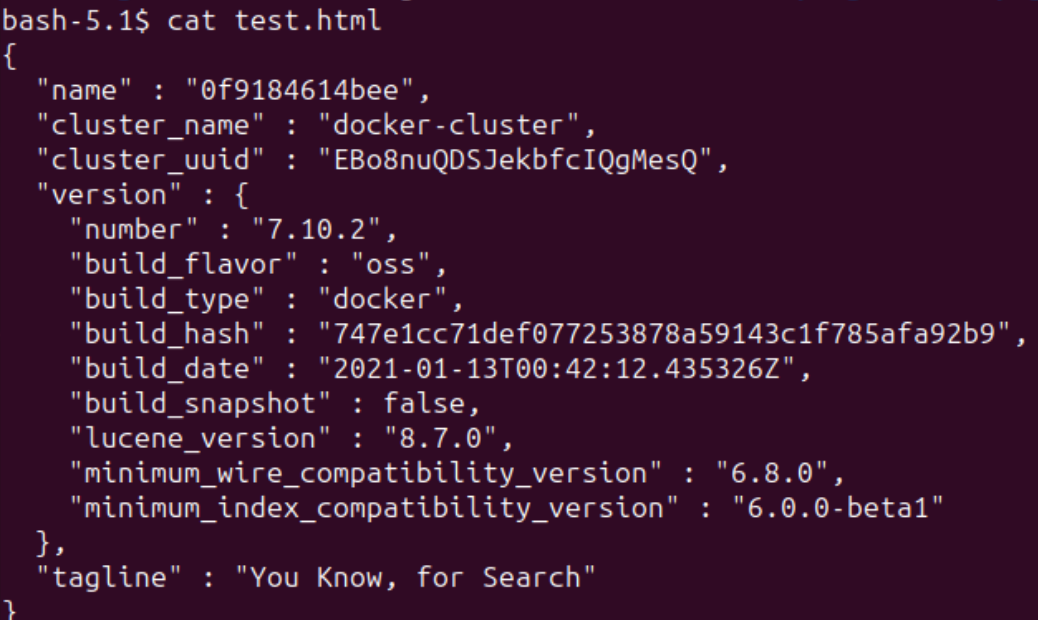
wget http://elasticsearch:9200 -O /var/lib/grafana/test.html
cat /var/lib/grafana/test.htmlYou should get something like this.
 PaulePils
commented
10 months ago
PaulePils
commented
10 months ago I have the same issue. I tried the above commands in proxmox terminal and in portainer. Both wget and cat worked, but still there is the error with "bad gateway".
sticky99
commented
10 months ago Wget and cat works. Output is the very same other than for the name and cluster_uuid
sticky99
commented
10 months ago Not sure if this of any use at all since I know little of how docker networking works.
I installed tcpdump on the elasticsearch container, then ran a packet capture while in Grafana I clicked the 'Save & Test' button within the elasticsearch configuration, and no matter what interface I used on the tcpdump capture command no packets are captured. Which in a non-container solution would make me think this is a networking issue.
sticky99
commented
10 months ago Actually.. scrub that. I installed tcpdump on the grafana container too, and I can see it sends the packet to the elasticsearch container on the right port, and it gets a response as well, but the response contains a RST that kills the connection.
sticky99
commented
10 months ago And I've just figured it out and its simple and my mistake. Within the elasticsearch config in Grafana, in the URL field I had the IP address of 192.168.10.202 and the port number, and when I just replaced it with elasticsearch it resolved correctly and all is good.
Thanks for your efforts on this..
bsmithio
commented
10 months ago Ah, that makes sense! I should've asked what your URL was in Grafana, I assumed it was http://elasticsearch:9200 like in the config guide. @PaulePils are you able to resolve your issue by using http://elasticsearch:9200 instead of http://(your server ip):9200?
PaulePils
commented
10 months ago The connections works now. I still have some other problems but they are not related to this thread
Lost a HD, so had to reinstall this from scratch. All is working except elasticsearch. I first noticed this when adding elasticsearch as a data source, it produced the error
Elasticsearch error: Bad GatewayI tried to connect to the URL via a browser on port 9200 without success. Looking at the container the container is running
but looking at netstat I don't see ports 9200 or 9300 as open
when I look at the logs for the container I see plenty of info messages, but no errors
Am I missing something obvious?