capstone-coal / pycoal

Python toolkit for characterizing Coal and Open-pit surface mining impacts on American Lands
http://capstone-coal.github.io/
GNU General Public License v2.0
28 stars 14 forks source link

Get More Data #115

Closed ghost closed 6 years ago

ghost commented 7 years ago

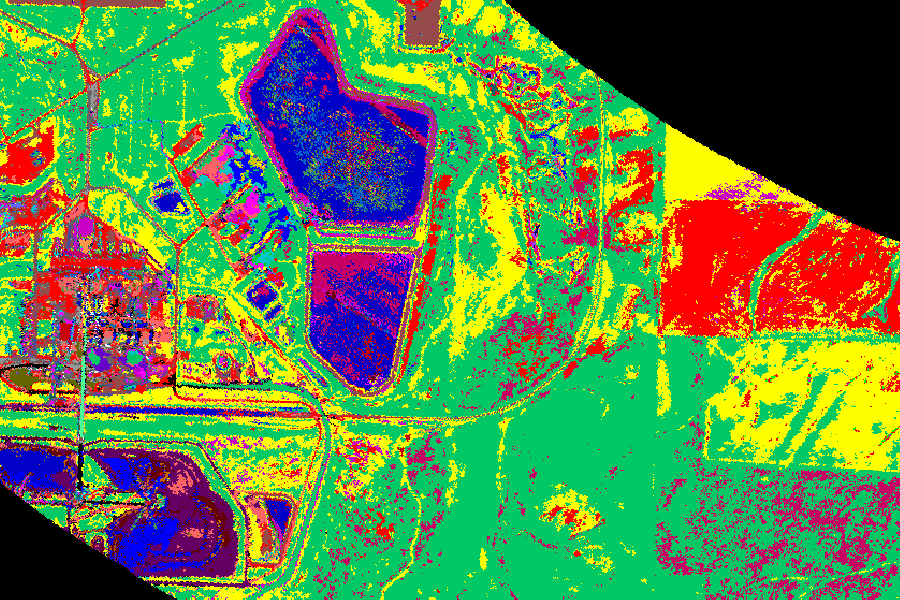
Although we are still formalizing our San Juan Mine case study (contained in the GIS Bundle and the Final Report Submission), further development of COAL would be promoted by finding more data to experiment with. By searching for locations of coal mines in various states a number of images were found which contained results of limited interest. The best possible data would be high-resolution scans of another coal mine, or a region we want to search for something else that is contained within the USGS Spectral Library Version 7. For example, perhaps there are high-resolution scans of a gold mine somewhere that you could use to look for arsenic evaporates. Environmental scientists or the AVIRIS-NG team might know where to look.

lewismc commented 7 years ago

I spoke with David Ray Thompson on this point exactly last week. I'm meeting with Sarah Lundeen and Winston Olson-Duvalln who between them manage the AVIRIS Science Data System, with the aim of possibly transferring over portions/the entire AVIRIS archive (~300TB) over the course of the XSEDE Startup Allocation. I think this depends on what we actually want to achieve from the startup allocation though so lets take a step back for a minute or two

What is our objective?

  1. sincere performance benchmarking of the toolkit? or

  2. determine reliability/accuracy of the generated data products? In order to determine this, David advised that we would need to obtain in-situ data for validation sites which back up the geological truth with our classification accuracy. Additionally, it will also be necessary for us to obtain in-situ data from different sites than which we trained the classier on such that we could see how well it performs. This is very typical for critical analysis of machine learning approaches, or

  3. to generate the worlds first, comprehensive archive of environmentally correlated science data products for the AVIRIS dataset which is of course the worlds largest hyperspectral remote sensing dataset? I personally feel that we may wish to undertake this leap during a subsequent XSEDE Research Allocation. I think we would be best to spend our time on 1 and 2 above which would drive more publications... additionally this gives the project more credibility as well moving forward.

in terms of publishing…

  1. black box classifiers are less attractive from a publishing perspective, we should look into different classifiers. Spectrum fitting classifiers are preferred... I need to learn more about how we can make the classification process more transparent however right now we ARE essentially doing spectrum fitting so we may have already won half the battle here.
ghost commented 7 years ago

Objectives (1) and (2) were my main thoughts when filing this issue. A second case study, particularly one with different parameters such as image size or spectral features, would give us practice working with new data sets and exercise parts of the library to challenge assumptions that may have been made in the initial iteration. It would also give us new and interesting things to look at while testing performance and behavior, and potentially add insight to another environmental problem area. One place to look for improvements may be the many spurious classifications we made in some of the low-resolution imagery.

I think it would be a little premature to use COAL for bulk processing just yet. One of the motivational issues to think about is whether COAL should be targeted to users with specific applications (e.g., NASA studying the Gulf Oil Spill or CH2M measuring waste at superfund sites) or targeted to bulk processing as in objective (3).

I am not familiar with "spectrum fitting" or why such classifiers are preferred (by whom?). I don't think our current method is really a black box, however. The spectral angles algorithm provided by Spectral Python is, I believe, backed up by scientific papers and is really quite simple. Spectral angles uses an algebraic procedure to come up with a measure of difference between a pixel vector and a class vector. By calculating angles for multiple class vectors and comparing the difference, we choose the class with the least difference. I think it's important to emphasize that the spectral angles classifier is not trained: No previously seen data is incorporated into future classifications.

Neural networks and other machine learning methods with a training stage are actually much more of a black box, which has raised concerns in the AI community, not to mention sensationalist headlines like "Artificial Intelligence Does Thing That Nobody Understands". The initial development of this project was simplified by using what Spectral Python provided, but other classification strategies could be readily implemented by hand or from ML libraries like OpenCV. Literature on specific applications of hyperspectral classification is probably the best place to start.

The various organizations whose data we reviewed in New Mexico might be able to provide some onsite measurements: Sierra Club, New Mexico water quality, EPA, etc. My guess is that they would find evidence of acid mine drainage along the waterways we identified, preferably in places where it had not been looked for before. It would be very interesting to see what the actual chemistry is, because I doubt it is actually schwertmannite. The sludge measurements inside the tailing ponds seemed to be quite on point however.

lewismc commented 7 years ago

I agree with you @browtayl . I'm going to finish the REST API then propose that we release 0.6.0. I'll update once that has been done. In the meantime, if you fancy making an attempt to locate mining sites which have been surveyed then by all means please do. It became obvious to me that the investigators in charge of individual flight campaigns really didn't know if they has flown a mining site or not. I am not sure of a particularly reliable method for identifying mining sites over a catch all brute force approach... any ideas?

Regardless, we agree on 1 and 2 and I am more than happy to move towards those objectives.

ghost commented 7 years ago

What I did when looking for coal mines was search for each state's mining regulatory agency which typically publishes records of mining operations and claims (a search for "coal mines in [state]" was typically sufficient). I believe I also consulted a map of coal deposits in the US to narrow down which states to look for. Some state agencies provide interactive maps that can be browsed for permit boundaries, others provide only raw text, others make you contact someone to access the data. Once I found coal mines for a given state, I browsed the AVIRIS data portals to see if any flights looked like they scanned each area, and then did a visual check of the quicklook image.

That is how I found the Craig, Co., Palisade, Co., and West Virginia images. In general it was rather laborious searching for data and cross-referencing maps. A similar process could be undertaken for other kinds of mining operations, but the first thing I'd do is browse the USGS Spectral Library Version 7 to see what kinds of samples they have that we might want to look for, and then find industries that might be associated with them. Gold mining might be worth putting on the short list because it tends to produce distinctive waste streams. Or a broader perspective could be taken by looking for more common land covers such as concrete or farmland.

We were incredibly lucky that we got high-resolution imagery of a coal mine and that there just happened to be relevant samples in the spectral library.

ghost commented 7 years ago

For example, an interactive map of Coal Mines in New Mexico is provided by the New Mexico Energy, Minerals and Natural Resources Department, Mining and Minerals Division. Then you zoom to the corresponding region in the AVIRIS-NG data portal to see if anything lines up.

If searching for imaged mines is something that will be done frequently, it might be more effective to obtain the mine permit and AVIRIS flight boundary GIS data to import and overlay them into a GIS application for easy (perhaps even automatic) identification. The interactive viewers are convenient, but I think it would be necessary to contact the agencies to obtain the actual data for local use.

Either way, finding suitable imagery is a small job of itself. I probably won't be able to devote much of my free time to searching for this, but I can try to drop some of the links I dug up during Capstone.

ghost commented 7 years ago

As another example, the West Virginia GIS Technical Center links to maps from the WV Geological and Economic Survey which provides coal maps with a REST API and an interactive viewer.

And here is the viewer from the Colorado Department of Reclamation and Mining Safety.

As you can see, there is no consistency between these various state agencies. Obviously it would be preferable if there were a national mining data set (perhaps consult EPA or another federal agency to see if something like this exists), but it appears that mining is regulated on a state by state basis.

ghost commented 7 years ago

Wikipedia provides some maps of coal mining deposits by state: https://en.wikipedia.org/wiki/Coal_mining_in_the_United_States#Coal_production_by_region

A similar methodology could presumably be used to find other kinds of mining operations.

ghost commented 7 years ago

I came across the website of the OSU Mass Spectrometry Center which suggested the possibility of making our own coal mine spectral samples to extend the USGS Spectral Library if need be. That lab specializes in biochemistry, but we could find another that handles minerals. A geologist would be able to guide us to mine drainage mineral samples.

ghost commented 6 years ago

The primary applications of remote sensing at OSU appear to be in forestry and ecology:

I will be making connections with researchers at OSU to see what opportunities exist in this area. Oregon doesn't have any coal mines, but forestry is one of our primary industries. It is quite plausible that the image processing methods we devised could be applied seamlessly to this problem.

ghost commented 6 years ago

Although @lewismc knows more about it than me, I am dropping a reference to The Hyperspectral Infrared Imager (HyspIRI) which may be a target for COAL research and development in the future. Beaming hyperspectral imagery on a continuous basis would offer much broader and more frequent coverage than discrete AVIRIS flights, however at lower resolution. The draft manuscript by Dr. Wendy Calvin (in our Google Drive) discusses some of these considerations. Much more limited bandwidth imagery is currently available from The Advanced Spaceborne Thermal Emission and Reflection Radiometer (ASTER). Questions include whether there are any other imagers we should know about and what file formats the data will be published in.

lewismc commented 6 years ago

ACK. Over time I think Pycoal should probably be adapted to accept a flag denoting the particular instrument the input dat came from. This is food for thought.

bdegley4789 commented 6 years ago

Here are some data products I found from the AVIRIS-NG data product portal that could be good to look at next. I already started running mineral correlation on the first one

Location: North West Colorado Site Name: Craig Power Plant Coal Mine rgb image preview: https://avirisng.jpl.nasa.gov/aviris_locator/y14_RGB/ang20140912t192359_RGB.jpeg wget -m "ftp://avng.jpl.nasa.gov/AVNG_2014_data_distribution/L2/ang20140912t192359_rfl_v1c/"

Location: West of Bakersfield, CA Site Name: COAL 1 rob image preview: https://avirisng.jpl.nasa.gov/aviris_locator/y14_RGB/ang20141005t221609_RGB.jpeg wget -m "ftp://avng.jpl.nasa.gov/AVNG_2014_data_distribution/L2/ang20141005t221609_rfl_v1c/“ Site Name: COAL 2 rgb image preview: https://avirisng.jpl.nasa.gov/aviris_locator/y14_RGB/ang20141005t223845_RGB.jpeg wget -m "ftp://avng.jpl.nasa.gov/AVNG_2014_data_distribution/L2/ang20141005t223845_rfl_v1c/“ Site Name: COAL 3 rgb image preview: https://avirisng.jpl.nasa.gov/aviris_locator/y14_RGB/ang20141005t224338_RGB.jpeg wget -m "ftp://avng.jpl.nasa.gov/AVNG_2014_data_distribution/L2/ang20141005t224338_rfl_v1c/“ Site Name: COAL 4 rgb image preview: https://avirisng.jpl.nasa.gov/aviris_locator/y14_RGB/ang20141005t225213_RGB.jpeg wget -m "ftp://avng.jpl.nasa.gov/AVNG_2014_data_distribution/L2/ang20141005t225213_rfl_v1c/“ Site Name: COAL 5 rgb image preview: https://avirisng.jpl.nasa.gov/aviris_locator/y14_RGB/ang20141005t230807_RGB.jpeg wget -m "ftp://avng.jpl.nasa.gov/AVNG_2014_data_distribution/L2/ang20141005t230807_rfl_v1c/“ Site Name: COAL 6 rgb image preview: https://avirisng.jpl.nasa.gov/aviris_locator/y14_RGB/ang20141005t232341_RGB.jpeg wget -m "ftp://avng.jpl.nasa.gov/AVNG_2014_data_distribution/L2/ang20141005t232341_rfl_v1c/“ Site Name: COAL 7 rgb image preview: https://avirisng.jpl.nasa.gov/aviris_locator/y14_RGB/ang20141005t233722_RGB.jpeg wget -m "ftp://avng.jpl.nasa.gov/AVNG_2014_data_distribution/L2/ang20141005t233722_rfl_v1c/“

Location: East of San Fransisco, CA Site Name: Delta 56 Zone 2 and Sulphur Mine rgb image preview: https://avirisng.jpl.nasa.gov/aviris_locator/y14_RGB/ang20141125t212124_RGB.jpeg wget -m "ftp://avng.jpl.nasa.gov/AVNG_2014_data_distribution/L2/ang20141125t212124_rfl_v1c/“ Site Name: Delta 57 Zone 2 and mine rgb image preview: https://avirisng.jpl.nasa.gov/aviris_locator/y14_RGB/ang20141125t213206_RGB.jpeg wget -m "ftp://avng.jpl.nasa.gov/AVNG_2014_data_distribution/L2/ang20141125t213206_rfl_v1c/“

ghost commented 6 years ago

Awesome work finding these. I have been getting bored of looking at the San Juan Mine so am very curious what you will find in these images. We had some mixed luck last year classifying other imagery we found, so this will be a good test of the library as much as of the data. We classified some images from Colorado and West Virginia but the results were thrown off by the low resolution. For example, I'm pretty sure the "fields of opal" that were identified in West Virginia were actually clouds. I'll stay out of your way as you work on this but more and more people are looking at this library so do keep us updated!

bdegley4789 commented 6 years ago

Sounds good! We will be staging all the products from these case studies in here

bdegley4789 commented 6 years ago

@lewismc @browtayl Do either of you think it would be a good idea to switch the default example to this aviris image?

Location: North West Colorado Site Name: Craig Power Plant Coal Mine rgb image preview: https://avirisng.jpl.nasa.gov/aviris_locator/y14_RGB/ang20140912t192359_RGB.jpeg wget -m "ftp://avng.jpl.nasa.gov/AVNG_2014_data_distribution/L2/ang20140912t192359_rfl_v1c/"

It is only 6GB instead of the 17.5GB one we are currently using with San Juan mine case study. This would make the examples much faster to run for new users and put less of a storage constraint on them. All the images on the website and poster are of the San Juan Mine case so maybe it wouldn't be a good idea. Either way, let me know what you think

lewismc commented 6 years ago

@bdegley4789 I think that this is a good idea if and only if it produces some interesting GIS products which are more appealing over and above the existing/original San Juan mine case study. At the end of the day, 'most' folks using or projected to use this toolkit are well aware of the pretty huge file sizes involved with hyperspectral remote sensing data. Do you have examples GIS products from the Craig Power Plant Coal Mine case study for us to view before we go ahead with this?

ghost commented 6 years ago

For reference I assume the default example in question comes from this line in the source: https://github.com/capstone-coal/pycoal/blob/b24db46367de4abb234ff6c18ccdda6bd26e5705/examples/example_mineral.py#L63

@lewismc was actually the one who implemented the example scripts as can be seen in the git blame so I have less experience running them.

@bdegley4789 makes a very good point about the large file being hard to work with. A more elegant solution than switching data sources might be to crop the San Juan imagery down to a more usable size. This is how the 10x10 test images were generated. Doing this would just require a little digging to ensure the resulting image has the mining features we're interested in (and that the resulting file is correctly georeferenced), but I'd say it's worth looking into. This would also make it more feasible to do something like a Jupyter Notebook which is currently impractical.

The San Juan case study is currently the one we have done the most analysis on, although I now recall we did start a cursory review of the Craig site last year and used it as the website carousel image for mineral identification. We did find mining proxy classes in that image, but some of them were in unexpected places such as an open field adjacent to the power plant.

bdegley4789 commented 6 years ago

@lewismc I staged the products from this site in here. The mineral classification and mining classification are good. But it doesn't look like there is much of anything at this site for environmental correlation. So, it might not be the best for the examples

bdegley4789 commented 6 years ago

I'll run through those other sites I listed here and see if there is anything interesting. @browtayl solution of cropping the san Juan image could also work

lewismc commented 6 years ago

I'm going to close and eventually address this within the COAL-SDS run.