 caravagn
commented
4 months ago
caravagn
commented
4 months ago Hi @sigven, thanks for your comments:
-
I came across that need as well, but I could not find a special solution. Btw, did you notice the black/gray dots here above horizontal line at 0? Each dot is a breakpoint, and it's black if the segment has a Major+minor allele counts that exceeds the Y-axis plot. So there you see that there are certainly focal amplifications on chromsome 7, some with more than 6 copies... can you suggest something better? Maybe some ad-hoc visualisation?
-
the
plotlything seems usefull, can you give me some code to reproduce it? I can definitely change the behaviour of thechromosomeargument, I never thought it would make much sense as it is done now..
 sigven
 pdiakumis
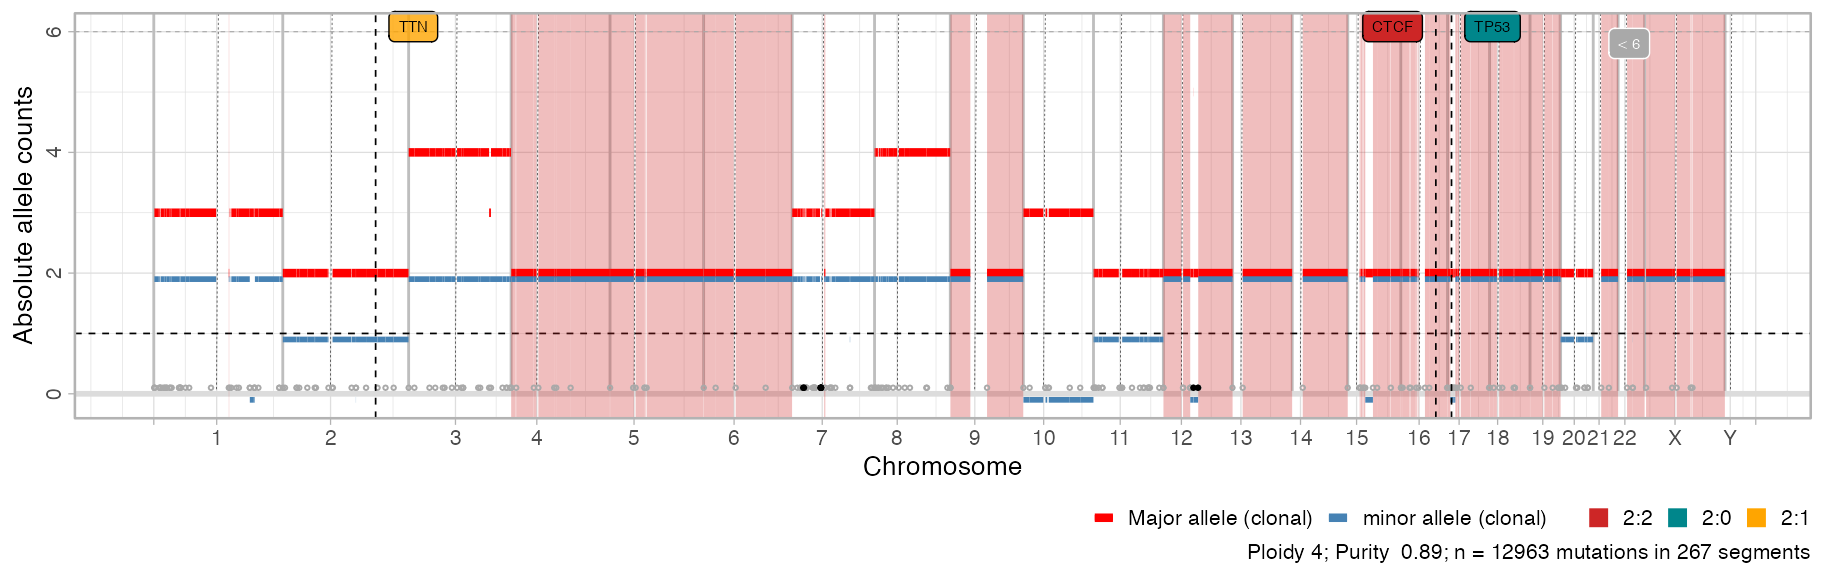
Hi,
Thanks for a very nice package with lots of great functionality for copy-number processing and visualization. This is really missing from other packages. Great work! I have been playing a bit with data from our tumor samples, and want to share some thoughts on the visualization function
plot_segments:plot_segmentsto plotly, i.e.plotly::ggplotly(CNAqc::plot_segments(x)), which, if working optimally, would give the users a powerful oppertunity to interact with the segments (and potentially annotations therein), being able to zoom in on particular chromosomes etc. I thought that restricting thechromosomesargument inplot_segmentswould give me a higher-resolution view of a particular chromosome, but it seems that the whole genome track is also plotted for this?Happy to get your input on these matters:-)
kind regards, Sigve