Closed nicmare closed 2 years ago
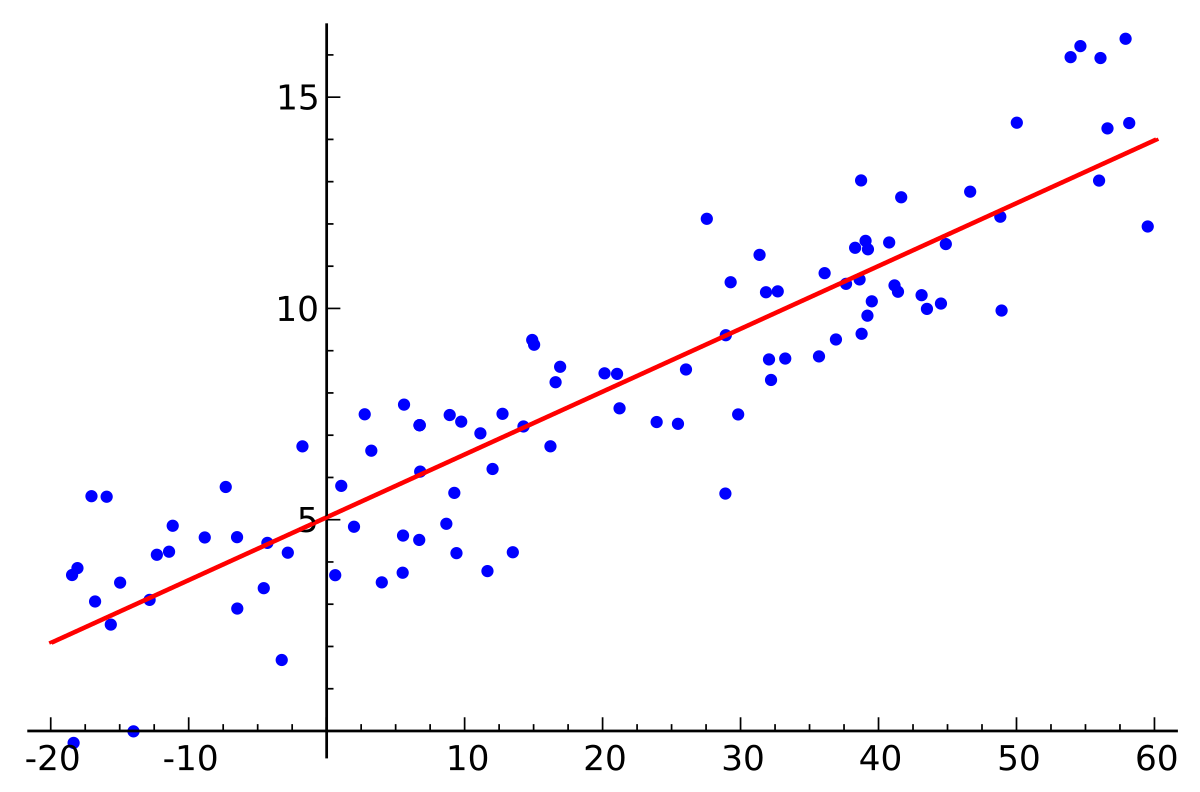
i build this scatter graph chart with chartist: now i would like to show a linear trend line like:
anyone have an idea how to achieve this? my code for the points is based on this syntax: {x:1602827212, y:43.9582}
Unfortunately multitype charts are not supported as of right now.
i build this scatter graph chart with chartist: now i would like to show a linear trend line like:

anyone have an idea how to achieve this? my code for the points is based on this syntax: {x:1602827212, y:43.9582}