 elitastic
commented
2 years ago
elitastic
commented
2 years ago I had the same problem, solved it by creating a plugin to draw a custom html legend and align it myself:
usage
html:
<div style="display: flex;">
    <div style="height: 100px; width: 100px;">
         <canvas></canvas>
    </div>
    <div id="legendDiv"></div>
</div>
chartjs config:
{
type: 'doughnut',
data: {
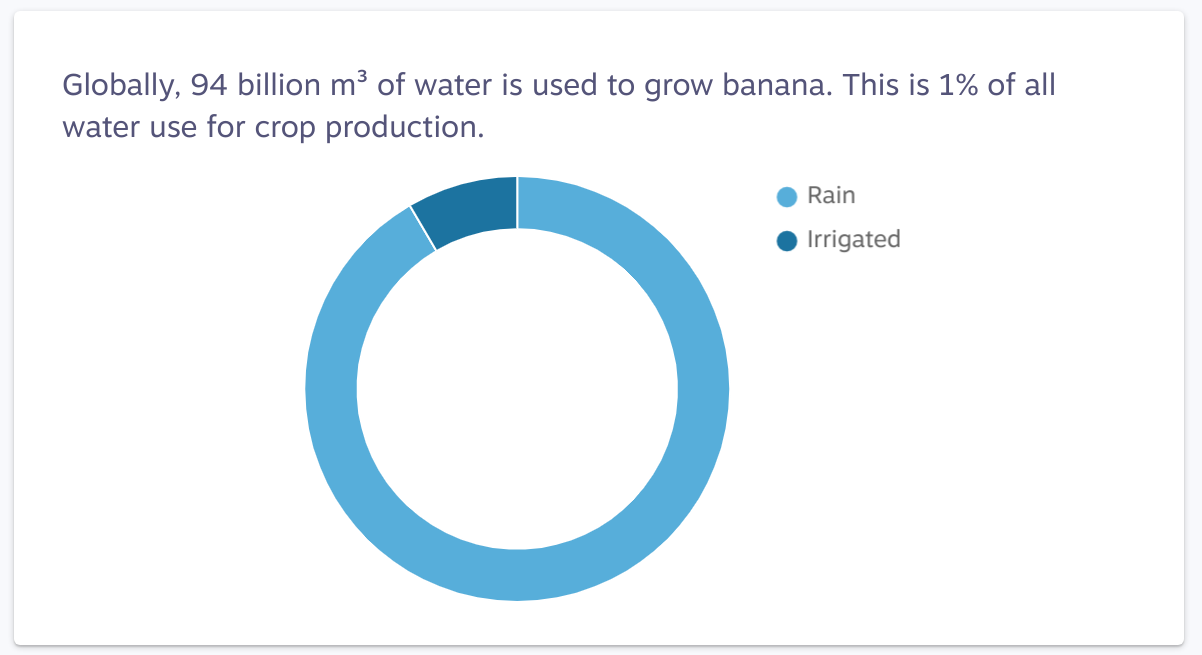
labels: ['Rain, 'Irrigated'],
datasets: [{
data: [10, 2]
}]
},
options: {
plugins: {
htmlLegend: {
legendDiv: document.getElementById('legendDiv'),
clickable: false, // optional
maxColumns: 2 // optional
}
}
}
}plugin
import { Chart, ChartType, Plugin } from 'chart.js';

class HtmlLegendPluginType implements Plugin<'bar'>
{
    id = 'htmlLegend';

    afterDraw(chart: Chart, args: any, options: any)
    {
        const legendOptions = options as HtmlLegendOptions;
        legendOptions.clickable = legendOptions.clickable ?? false;
        legendOptions.maxColumns = legendOptions.maxColumns || 1;

        if (legendOptions.legendDiv)
        {
            const legendDivContainer = legendOptions.legendDiv;
            legendDivContainer.innerHTML = '';
            const legendDiv = document.createElement('div');
            legendDiv.style.display = 'flex';
            legendDiv.style.flexDirection = 'row';
            legendDiv.style.flexWrap = 'wrap';
            legendDiv.style.margin = '0px';
            legendDiv.style.padding = '0px';

            legendDivContainer.appendChild(legendDiv);

            const labels = chart.options.plugins.legend.labels.generateLabels(chart);

            labels.forEach((label, idx) =>
            {
                const isLast = idx == labels.length - 1;
                const listItemDiv = document.createElement('div');
                listItemDiv.style.alignItems = 'center';
                listItemDiv.style.cursor = legendOptions.clickable ? 'pointer' : 'default';
                listItemDiv.style.display = 'flex';
                listItemDiv.style.flexDirection = 'row';
                listItemDiv.style.marginBottom = !isLast ? '4px' : '0px';
                listItemDiv.style.width = `${Math.round(100 / legendOptions.maxColumns)}%`;

                if (legendOptions.clickable)
                {
                    listItemDiv.onclick = () =>
                    {
                        chart.toggleDataVisibility(idx);
                        chart.update();
                    };
                }

                // Color box
                const boxSpan = document.createElement('div');
                boxSpan.style.background = label.fillStyle?.toString();
                boxSpan.style.borderColor = label.strokeStyle?.toString();
                boxSpan.style.borderWidth = `${label.lineWidth}px`;
                boxSpan.style.display = 'inline-block';
                boxSpan.style.height = '16px';
                boxSpan.style.marginRight = '6px';
                boxSpan.style.width = '16px';

                // Text
                const textContainer = document.createElement('div');
                textContainer.style.color = label.fontColor?.toString() || '#666';
                textContainer.style.margin = '0px';
                textContainer.style.padding = '0px';
                textContainer.style.flex = '1';
                textContainer.style.textDecoration = label.hidden ? 'line-through' : '';

                const text = document.createTextNode(label.text);
                textContainer.appendChild(text);

                listItemDiv.appendChild(boxSpan);
                listItemDiv.appendChild(textContainer);
                legendDiv.appendChild(listItemDiv);
            });
        }
    }
}

declare module 'chart.js'
{
    interface PluginOptionsByType<TType extends ChartType>
    {
        htmlLegend: HtmlLegendOptions;
    }
}

interface HtmlLegendOptions
{
    legendDiv: HTMLDivElement;
    clickable?: boolean;
    maxColumns?: number;
}

export const HtmlLegendPlugin = new HtmlLegendPluginType();
satya-achanta-venkata
 prryplatypus
Feature Proposal
I'd like to control the alignment of pie / donot charts inside the canvas. These charts are currently always drawn in the center. When a legend is added it seems to be centered in the remaining space, while the legend seems to drawn al the way to the side.
I'd love to be able to control the position of these charts like we can control the legend using
positionandalignproperties. Ideally this also controls the position of the legend.Feature Use Case
I'm trying to create a chart a chart with a legend where the pie chart is close to the legend and the combination of the two is either center aligned or aligned to the left. But currently I can't control how it takes up the available space. I could have more control my creating the legend using html, but I'm already drawing multiple charts in the same project using the build in one.
I'd love to be able to create layouts like:
I realize this partly has been raised before, but that was for v1 and all of the links that where referenced are now broken. https://github.com/chartjs/Chart.js/issues/1266