 BaichenTan
commented
2 years ago
BaichenTan
commented
2 years ago I figured out that the first graph requires us to rescale the yaxis in log scale, adding the function scale_y_continuous() to our codes, but I am still confused of how we can make the second graph by using facet_wrap, what other functions should we use to set different binwidth for each sub-graph? Currently I create three distinct pictures and use ggarange to combine the three graphs into one graph, but I think that method is quite tedious so I thought there will be a simple way (just using facet_wrap) to realize this result.
 bensoltoff
How can I set the y-axis like this in R code? They are of unequal length ?
?
How can I using facetwrap while setting different binwidth for each graph in this pic 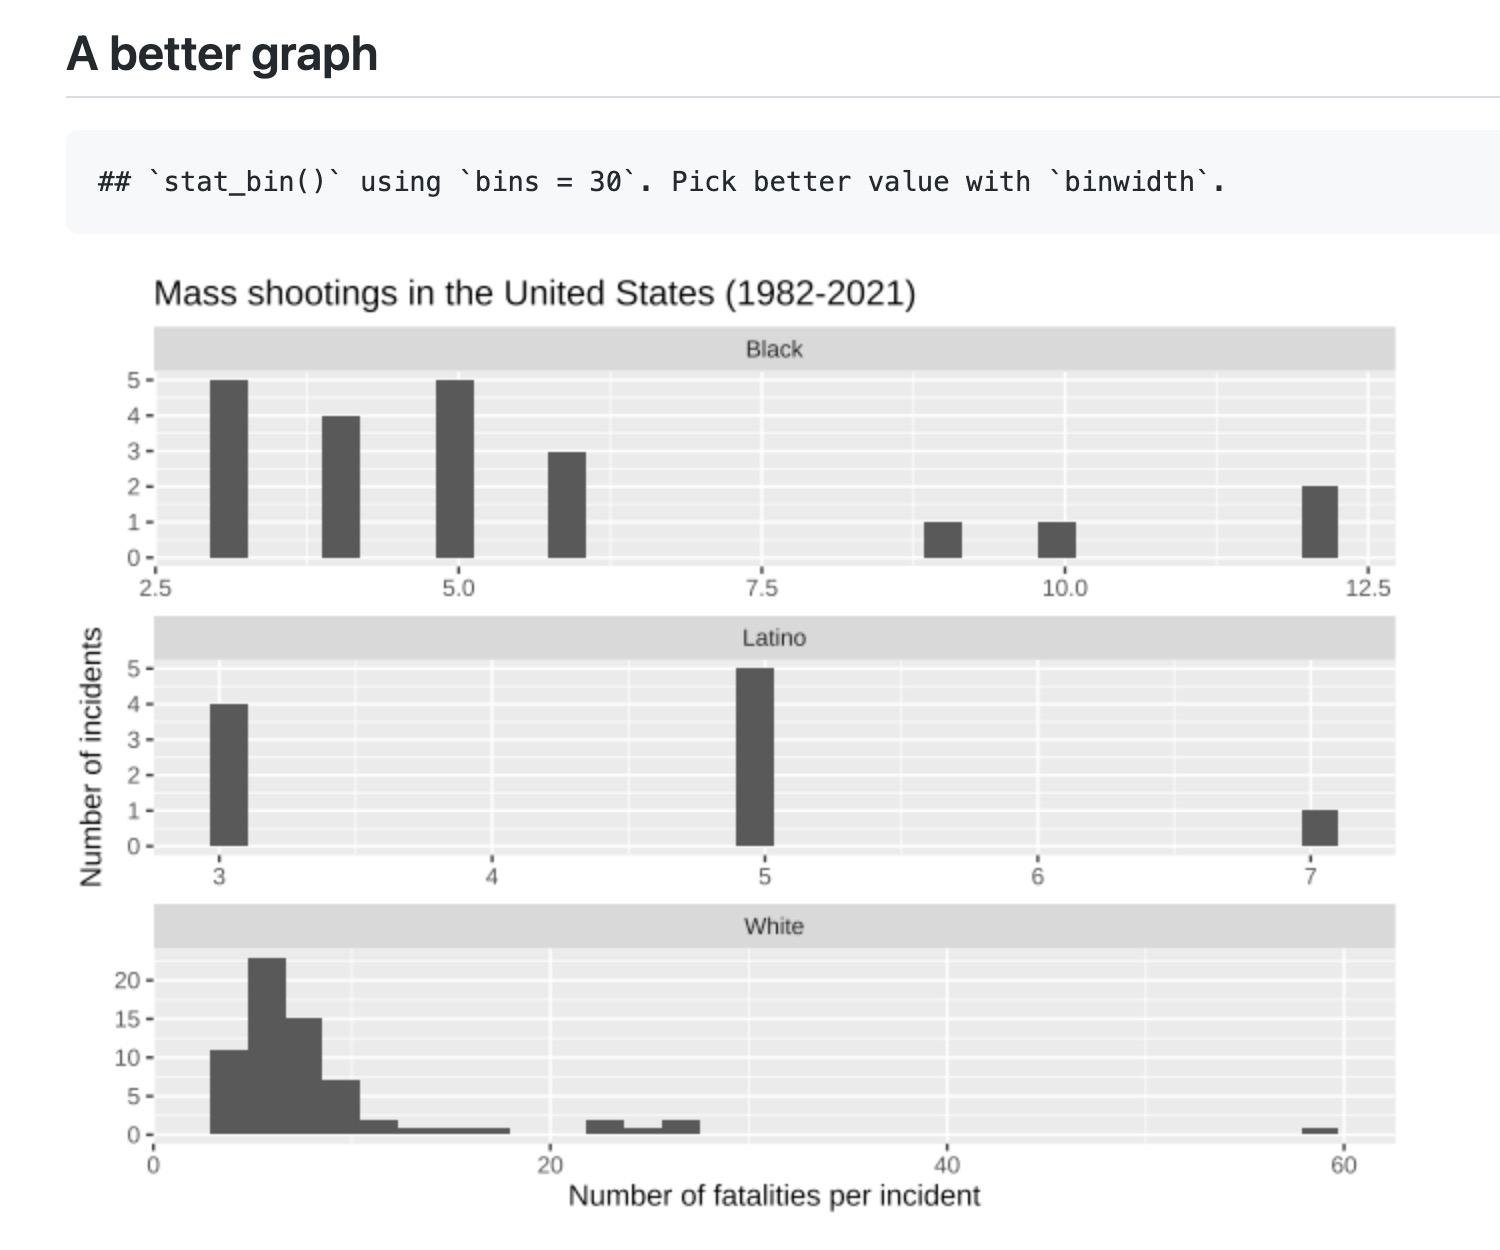 ? @bensoltoff