 cleardusk
commented
3 years ago
cleardusk
commented
3 years ago With dense_flag = False, the outputted 68 landmarks ought to be consistent with Dlib.
Open leolellisr opened 3 years ago
cleardusk
commented
3 years ago With dense_flag = False, the outputted 68 landmarks ought to be consistent with Dlib.
 dtoniolo
commented
3 years ago
dtoniolo
commented
3 years ago When _denseflag = False, the location of the points is the same as the dlib, right?
I'd like only to point out that the orientations x and y axis of the point clouds produced by 3DDFA are reversed, so you might need to keep that in mind to avoid inconsistencies1.
1 I've only verified this statement for the 68 landmarks, therefore I'm not sure about the other output types
 leolellisr
commented
3 years ago
leolellisr
commented
3 years ago Thanks guys, that helped!
How about the z-coordinate returned by 3DDFA? Is there any reference that shows the production or calculation of these values?
Thanks again!
dtoniolo
commented
3 years ago Here's what I figured out. 3DDFA uses an orthographic camera model (source: 3DDFA paper, equation 4)(see last section of these notes). So the transformation steps from a 3d mesh in BFM's system of coordinates should be the following:
The relevant sections of the code seem to be TDDFA.recon_verts() and similar_transform(). It seems that the scaling is done not with respect to the image size, but to the bounding box size. Moreover, the z axis is scaled by the average of the scale factors used of the x and y axis.
However, I'm not sure of my conclusions and it's not clear to me why the scaling is done in this manner.
Finally, even though I did my fair share of digging into the code, I wasn't able to figure out the following:
TDDFA?It's not much, admittedly, but hopefully this can help you get a better grip on this paper😉
 tkzky
commented
3 years ago
tkzky
commented
3 years ago Hello! I have some question about the z axis. I'd like to know does the Z coordinate represent the depth information of the landmarks? Looking forward to your reply!
 lewisandJiang
commented
3 years ago
lewisandJiang
commented
3 years ago With dense_flag = False, the outputted 68 landmarks ought to be consistent with Dlib.
Hi, how can i get 68 landmarks?
lewisandJiang
commented
3 years ago Congratulations on your great work and thanks for sharing it.
Is there any reference to the location of the landmarks on face (or a map of the landmarks) generated with _denseflag = True (the estimated 38k points)? Something like dlib in this image? https://pyimagesearch.com/wp-content/uploads/2017/04/facial_landmarks_68markup.jpg
When _denseflag = False, the location of the points is the same as the dlib, right?
I appreciate the attention.
Hi, could you tell me how can i get 68 landmarks?
 chriscohoat
commented
3 years ago
chriscohoat
commented
3 years ago From what I've been able to figure out so far ... the three most important lines in demo.py are:
param_lst, roi_box_lst = tddfa(img, boxes)
ver_lst = tddfa.recon_vers(param_lst, roi_box_lst, dense_flag=dense_flag)
draw_landmarks(img, ver_lst, show_flag=args.show_flag, dense_flag=dense_flag, wfp=wfp)
If you check out draw_landmarks, you'll see nums = [0, 17, 22, 27, 31, 36, 42, 48, 60, 68] which I've deduced is the following point groupings (in order): jaw, right eyebrow, left eyebrow, nose vertical, nose bottom, right eye, left eye, lips boundary, inner lips
The individual X and Y points are plotted with this line:
plt.plot(pts[i][0, l:r], pts[i][1, l:r], marker='o', linestyle='None', markersize=markersize, color=color, markeredgecolor=markeredgecolor, alpha=alpha)This looks confusing, but it seems to be saying that the X points for the current group are pts[i][0, l:r] and the Y points are pts[i][1, l:r], which gives you a list of X and a list of Y points.
If you add an item that references pts[i][2, l:r] it seems like that may be the corresponding Z point, as it prints a valid list of numbers. I haven't confirmed that this number plots in the right place in a 3D plot, but it seems promising.
 anmolduainter
commented
2 years ago
anmolduainter
commented
2 years ago I want to get dense landmarks location of a particular facial region example chin region? For this I think I need mapping information but I dont see any, is there any mapping information there for this?
 elias-Mimetrik
commented
9 months ago
elias-Mimetrik
commented
9 months ago The landmarks are stored inside the pickled file: https://github.com/cleardusk/3DDFA_V2/blob/master/configs/bfm_noneck_v3.pkl
data=pickle.load(open( "bfm_noneck_v3.pkl", "rb" ) )
keypoints = data['keypoints']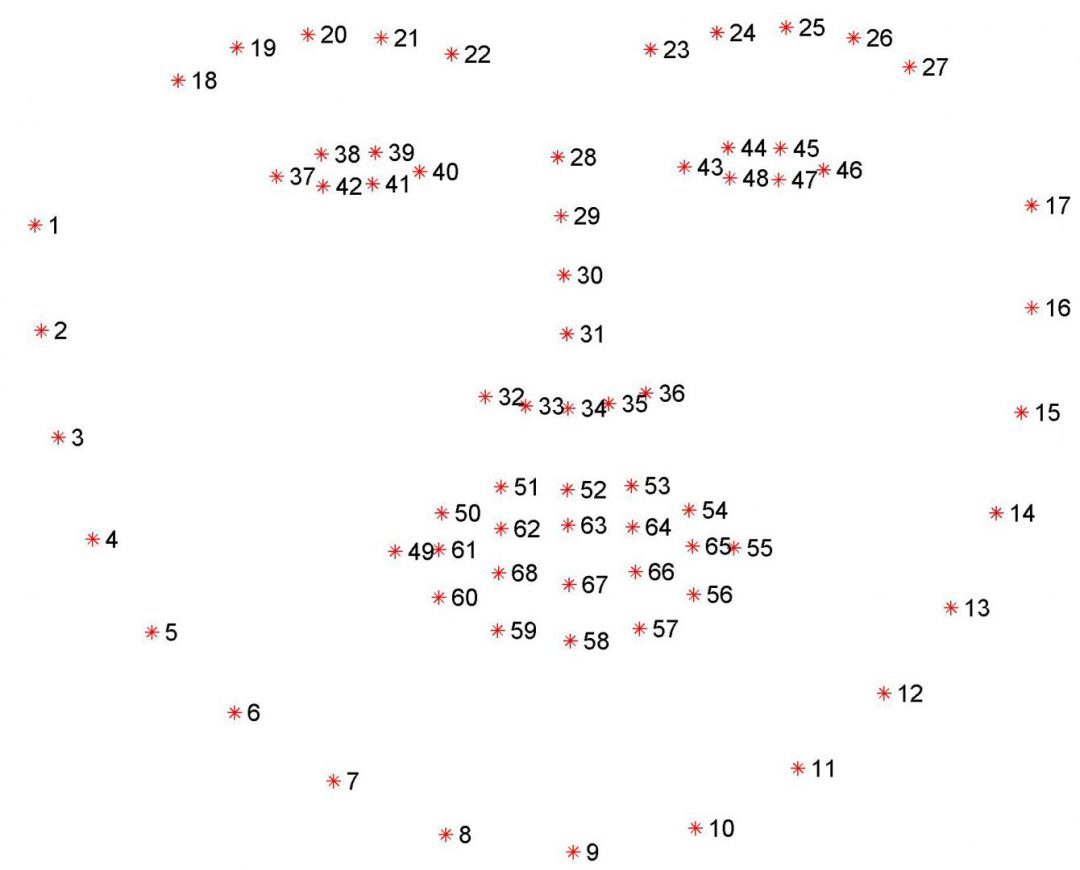
Congratulations on your great work and thanks for sharing it.
Is there any reference to the location of the landmarks on face (or a map of the landmarks) generated with _denseflag = True (the estimated 38k points)? Something like dlib in this image? https://pyimagesearch.com/wp-content/uploads/2017/04/facial_landmarks_68markup.jpg
When _denseflag = False, the location of the points is the same as the dlib, right?
I appreciate the attention.