Closed capnrefsmmat closed 3 years ago
Background: now that large-scale Google Surveys has ended, we will have to carefully choose which counties to sample with Google Surveys. We need a principled way to select these counties.
The high-level idea is that because we can choose where to sample, we are able to "see" where other surveys cannot, or reduce uncertainty in regions where we already have data from other surveys.
Some possible paths:
1) Reduce forecasting uncertainty: work with our forecasting team to look for places where both uncertainty and "risk" (e.g., expected COVID-19 incidence) is high in the coming weeks. 2) Reduce survey uncertainty: look at our other surveys (e.g., Facebook community question) to see where both uncertainty and "risk" is high. The problem with this approach is that uncertainty is highest where we have no samples at all, and we do not have an a priori way of prioritizing counties with no samples using survey data alone.
Some ways of prioritizing regions where we have absolutely no survey data:
1) Use our Google Health Trends sensor, which we believe to measure latent COVID-19 activity. We could train historical GHT to predict historical Google Surveys, and use future spikes in GHT to determine where to target Google Surveys samples. 2) Allow public health agencies to "nominate" themselves using an online form. 3) Allow the public (?) to "vote" on where we should sample; we can stratify the votes based on maximum population size to ensure that we have proper coverage of low-population counties. The idea is that the "crowd" would tell us where there may be high COVID incidence based on word of mouth, news reports, etc. 4) If we are choosing counties "by hand" week-to-week, we could even build a Twitter "sensor" which sifts through headlines and finds regions reporting high COVID-19 incidence. Then we look through the "top locations" every week and then decide ourselves where to sample.
Track the latest developments on thread: https://delphi-org.slack.com/archives/C010D0X6YKU/p1589835252374500
We don't currently have an automated way to set targeting of the surveys, so we'll have to select counties and then manually have Google set up surveys for those. We should, however, select some counties Real Soon Now, so we can demonstrate that these surveys are useful and deliver important results. Demonstrating their importance could lead to additional Google support to run surveys on other platforms.
Useful and important could mean different things:
I can see several routes to achieve these goals:
My assumption: Rapidly detecting outbreaks, and gathering information about their current trajectory to aid local forecasting, is more useful than generally reducing variance across the map. That is, accurate forecasts matter most when the trajectory is going up.
Hence we should pursue option 3 first. Collate counties from recent news about outbreaks. Target those counties. When results appear, pitch this to the CMU media office and to Google. Then try to get contacts who can lead us toward option 4.
Meanwhile, try to develop some kind of multi-armed bandit or other approach to automatically select counties, so we use an algorithm instead of the news to point us to outbreaks. Then we can become known for a forecasting and data collection process that helps public health agencies take early action.
The decision here again depends on who our audience is and what our audience needs. My assumption above is speculation about what health agencies would want; maybe something else is more useful.
But also, options 3 and 4 would involve media attention that would benefit public health indirectly, by informing people about the COVID-19 situation in their area. This is not insignificant. But before we pursue option 4, we'd want viz that's more suitable to that goal; we may end up with a detailed data explorer tool for public health experts and a separate "Here's the situation" site for the public.
Thanks for this summary, @capnrefsmmat.
The last I'll note is that if in response to Hal saying, "why aren't [we] sampling Georgia?", we can ask Google Surveys to sample all of Georgia, and then construct estimates for ten groups of counties. I was able to generate these ten groups by requiring each group to have at least 500k population.
This would sidestep the need to trawl news articles and make a list of FIPS if we can't find a volunteer. What do you think @ryantibs ?
Finally: this issue spans multiple issues now (short-term finding counties to sample using the news; long-term set up a methodology), so whoever volunteers to do the short-term should be assigned as a task co-owner.
I spoke to Ryan on Friday. He supports the news idea, and thinks we should try to do so in some systematic way: make a spreadsheet with news articles, record details of each county mentioned, and try to select them based on systematic criteria. For example, we might try to pick counties of varying size and in several regions of the country, provided they're above some population threshold and... perhaps other criteria, like "we don't have good data there currently". These criteria should be written down reasonably precisely.
Once we do this once or twice and show it works, we can work towards a long-term automated system.
I like your basic assumption @capnrefsmmat that "accurate forecasts matter most when the trajectory is going up".
There is a difficulty with option 3: when there is news reporting about an outbreak in a location, the local survey answers about "knowing someone in your community", even though it's "personally knowing someone...", may be skewed up because of the news coverage. Thus, we may be confusing cause and effect. The overcome this, we could:
@kjm0623v to generate a spreadsheet with the following columns:
If there are >20 counties, pick a rule that selects 10-15 of them that seems reasonable and isn't obviously partial to e.g. rich urban coastal counties.
Use a systematic method for selecting articles, and document this method.
Rob and I spoke to two journalists today about what data may be useful for them. They see two things that would be useful:
They will provide us some initial county suggestions soon, based on their reporting, and we can work to determine what's feasible for us.
Sounds great to me.
One issue to check on: are undocumented workers (of which there are many in meatpacking plants) reasonably represented in FB data.
Do you mean are undocumented workers reasonably represented in the FB user base? Because the survey specifically does not ask about citizenship, social security status, or any other high-risk personal information.
What I was wondering about is how location is determined. With Google, i think it's based in IP address, so it doesn't matter who you are, it only matters where you are connecting from. But with FB, I wasn't sure if it was based on IP address or on some profile information. If the latter, undocumented people may or may not provide uptodate, accurate, or truthful location information.
For Facebook, the first page of the Qualtrics survey asks for the respondent's ZIP code. We use that to determine location.
To close the loop on how to "merge" the Facebook Community and Google Community surveys, please see this notebook.
High-level summary:
I added a section in the end with proposals for how to choose counties, but it's nothing groundbreaking, unfortunately:
Punchline is that choosing counties is still hard, but once we choose them we can easily pool samples from FCS and GCS.
After I help nowcasting with their SE bootstrapping, I'll return to this vis a vis power analysis for MAB, etc.
Thanks Addison, excellent job. Few comments/updates:
Instead of focusing on where we can improve the FCS, we should actually focus on using GS so that we can best improve the combined signal. (We'd still fold in GS into the FCS first, then integrate the signals together into one combined signal). Doing this "right" is going to require SEs for the combined signal, so it's good you're working on that now.
(Even more so, I'd say we should focus GS so that we can best improve our nowcasts---estimates of Rt, the instantaneous reproduction number. But this is further downstream.)
I talked with Google folks today. (Not the Google Surveys, bu folks at Google Research.). They're potentially on board with helping us with the bandits idea, and even the previous idea of improving combined/nowcast as best as possible. We should 1. first decide whether this is a good idea to include them (I think it is), and 2. assuming that passes, think of a way to onboard them as best as possible and leverage their skills/expertise here.
Hey all, finally coming back to this now that Combined SE's are wrapping up (though my next big TODO is bringing Safegraph Mobility online as a signal?).
Interesting idea. But note that this is sequential testing, so you need to be extra careful in calculating significance (one of Ryan's areas of interest I recall).
Another open issue is the one I had mentioned earlier: clustering by contiguity and pop size make sense for overcoming a reporting threshold. but for providing covid analysis and forecasts, it might make more sense to cluster counties the way the individual state chose to do it, or otherwise at least by economic relationships / commuting patterns.
Updates:
@nloliveira can we get any other (possibly inferred) demographic information with the google surveys response file? Some of the counties Jimi has identified have a greater portion of people over 65, who may be less likely to use the internet.
@krivard Yes, there is inferred demographic information with the raw data (gender + age group). We were not using those in sensor construction because when there was missing demographics (the inferred demographic was "low confidence" therefore not reported) we would have to not use those points. The aggregated data, one step before sensor construction but one step ahead of raw data, has demographic information and can be found here.
@krivard I can take a look and investigate the counties in Jimi's list if you'd like, it should be very fast and I can get it done today.
@nloliveira Thank you! natalia :) this is a spreadsheet of news articles reporting on outbreaks
County FIPS State population population percent over age 65 Persons without health insurance, under age 65 years, percent median household income
I am still updating some data, I think I'll be done in about two hours. Free free to use it :)
Excellent! So the current tasks on this are:
Goal is to answer the questions: Do we have coverage of the counties that are in the news? Is that coverage representative of the county population regarding residents age 65 and older, who are most at risk?
52.6% of the counties in the list used to be surveyed by google. Among those, the proportion of 65+ is similar to the population proportion -- it is slightly larger in the survey since it doesn't take children into account. Here for a short report and for visualizing the proportion over time. (I haven't had time to document the code yet, will work on that today.)
Facebook survey coverage of 71.2% Google health trend coverage of 99.4% Google survey coverage of 50% Doctors visit coverage of 90%
Here for a note for News coverage by COVIDcast API Map of missing county by fb-survey_COVIDcast(48 counties)
Action on this would depend on which of those 30% of counties the symptom surveys are missing.
Return to this in a week to see if the more detailed hospitalization data (EMR hospital-admissions
today or monday; claims data in a few weeks) captures them, and if so, how bad a state those counties are/were in.
Coverage of News with COVIDcast API(2020-04-06~2020-06-10)
checked the date when the news occurred(issue_date
) and the COVIDcast API for 7 days windows.
Hospital Admission : 0.307692 Doctors Visit : 0.592308 JHHU : 0.769231 USAFacts : 0.769231 Symptom Surveys : 0.423077
It looks like that notebook computes the percentage of (counties mentioned in news articles) which (have at least one data point from the COVIDcast source between one week before and one week after the article was published).
We want to answer the question, "Do the symptom surveys provide adequate coverage of counties in the news? If a county is not covered by the symptom surveys, is that county more likely to be sick?"
To that end, could you do the following?
fb-survey:smoothed_hh_cmnty_cli
Ffb-survey:smoothed_hh_cmnty_cli
data, and counties without fb-survey:smoothed_hh_cmnty_cli
datahospital-admissions: smoothed_adj_covid19
H and doctor-visits:smoothed_adj_cli
D, ie P(c in H | c in F), P(c in H | c not in F), P(c in D | c in F), P(c in D | c not in F)hospital-admissions: smoothed_adj_covid19
for news counties in F over that same two-week period. Compare against news counties not in F. Do the same with doctor-visits:smoothed_adj_cli
.
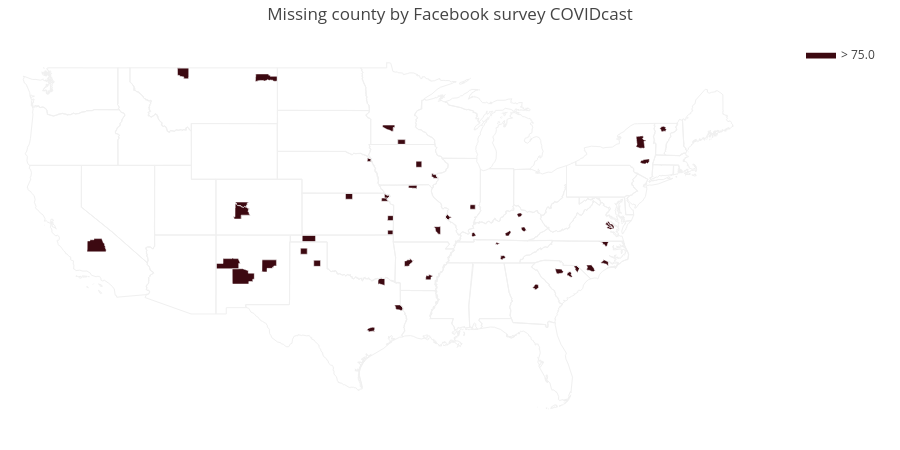
We're not going to be running the Google surveys daily past Friday, May 15. But we are still able to run the surveys on a small scale (i.e. smaller budget) if we want; we have complete control over how the survey is geographically targeted, so we can pick a strategy.
We could use it to augment the Facebook surveys, but the signals do not see comparable; see issue #2. Is there another, better use for these surveys that would improve forecasting or nowcasting?