 carly-rw
commented
5 years ago
carly-rw
commented
5 years ago This seems related to https://github.com/codesuki/react-d3-components/issues/131 but I don't see why the label should be hidden since there is clearly enough room for it.
Open carly-rw opened 5 years ago
carly-rw
commented
5 years ago This seems related to https://github.com/codesuki/react-d3-components/issues/131 but I don't see why the label should be hidden since there is clearly enough room for it.
 codesuki
commented
5 years ago
codesuki
commented
5 years ago So the decision point is here https://github.com/codesuki/react-d3-components/blob/master/src/PieChart.jsx#L119
Maybe this needs some tweaking. In case you have time would you play around with that a bit to see if you can improve it?
carly-rw
commented
5 years ago I'll take a look at it!
codesuki
commented
5 years ago Also thanks for reporting and sharing a way to reproduce the issue! It seems I was in a hurry the last time I commented.
Hi,
I am seeing what looks to be an error when the data used for a pie chart is heavy/skewed towards one particular category. The error is that the label for categories with fewer items in them are hidden. Example, a chart with categories containing [{ x: "example label", y: 1}, { x: "example label 2", y: 1 }, { x: "example label 3", y: 20 }, {...} ] will hide the labels for those with a y of 1. Increasing the size of the SVG does not seem to affect this in any way; only the relative distribution of the y values makes any difference to the labels appearing or not.
Ex,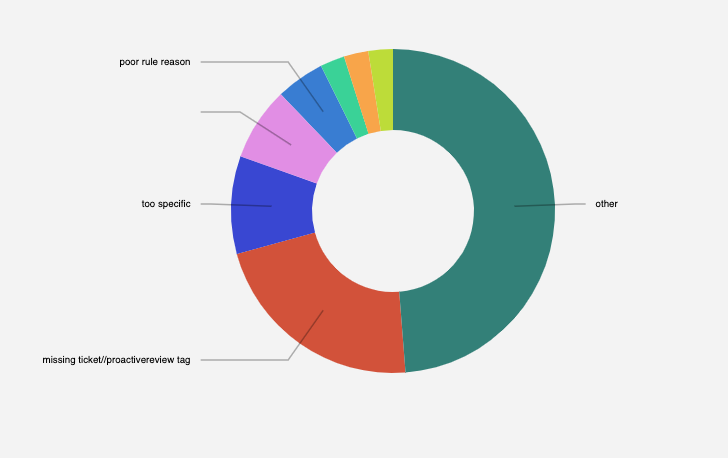
vs
The way the data appears when the error is occurring looks like this:
A fix or some guidance would be greatly appreciated.