communitybridge / docs

CommunityBridge & Related Services Documentation
9 stars 39 forks source link

Technology on Insights #15

Open germonprez opened 4 years ago

germonprez commented 4 years ago

Hi,

I'm hoping you can tell what technology you are using behind the scenes for Insights. For example:

https://lfanalytics.io/projects/agl%2Fagl/dashboard

Thanks!

canasdiaz commented 3 years ago

I'm having a look at this link https://tinyurl.com/y2pp5jcg

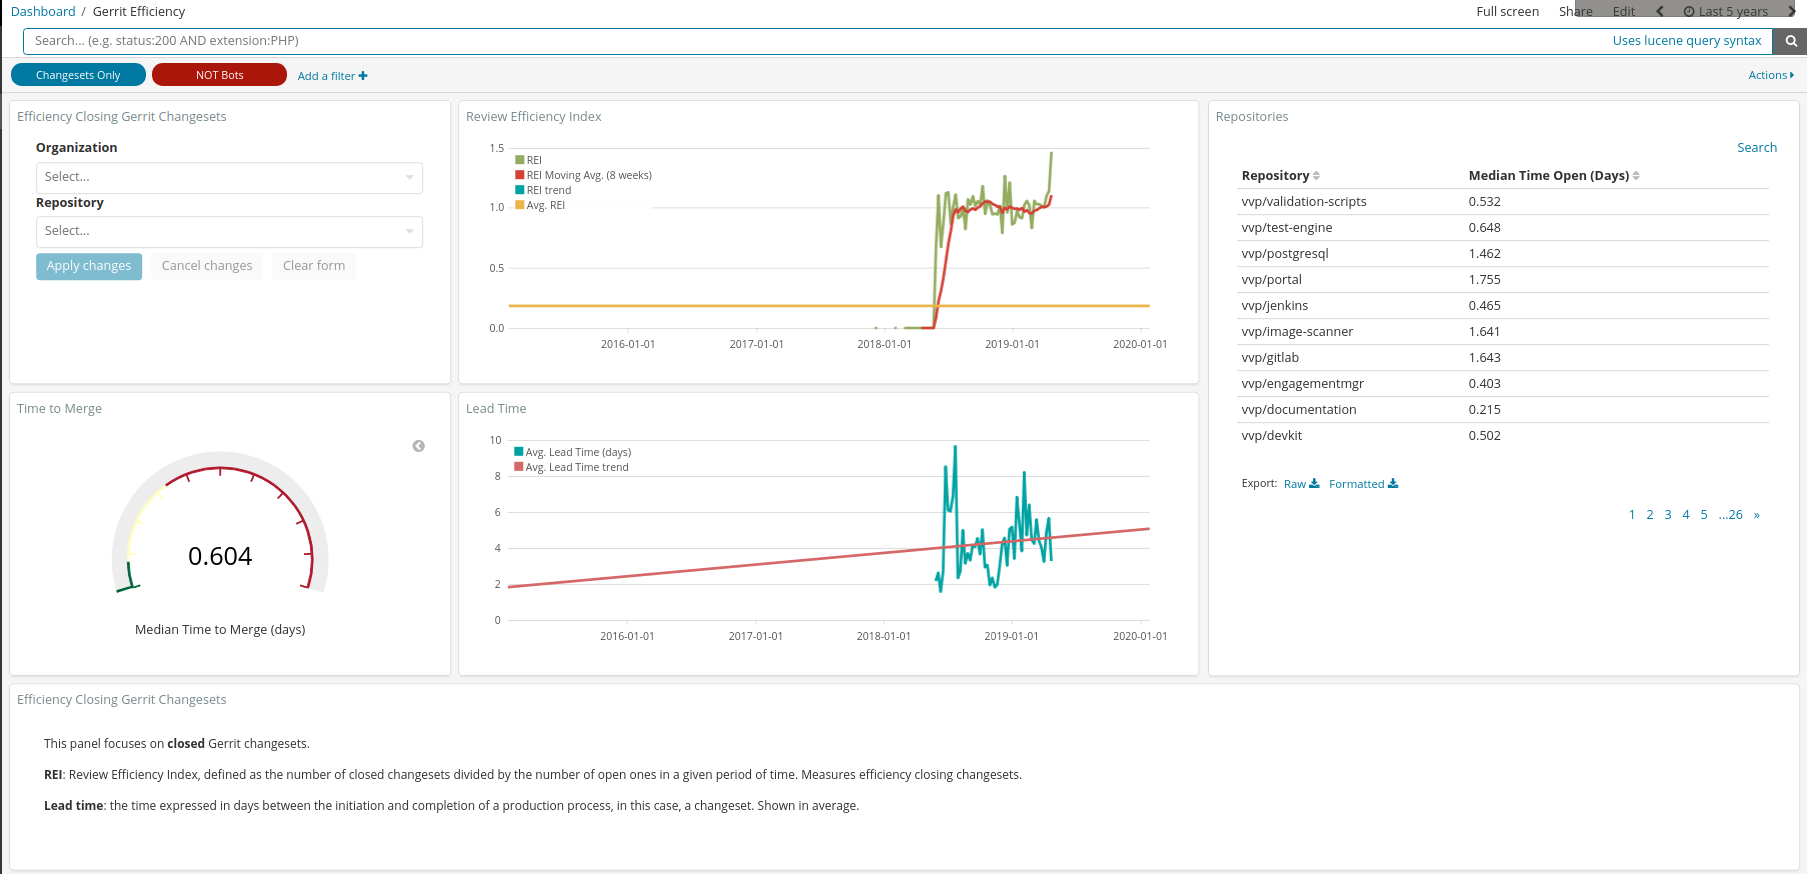
And have a look at this text:

image

This text is the same we have in the CHAOSS/GrimioreLab project on the Gerrit/Efficiency dashboard with only one change (changesets <-> reviews)

image

So this project could be using the CHAOSS Grimoirelab components (at least the visualizations) with no mention at all, which would be quite sad for us :(. I hope they can clarify the situation. For some of us, such a big organization using our work would be something to feel proud about.

PS: this is the file where this quite similar text can be found in the CHAOSS repositories https://github.com/chaoss/grimoirelab-sigils/blame/65d64dcb5f2c57d330beae6e73d8c0d2cb4998c4/json/gerrit_efficiency.json

canasdiaz commented 3 years ago

I had some doubts that were solved after visiting this link https://lfanalytics.io/s/lfn-onap/app/kibana#/dashboards?_g=(refreshInterval:(pause:!t,value:0),time:(from:now-15m,to:now)).

Sin nombre-2

So the Community Bridge project is using at least the panels done by the CHAOSS community in the Grimoirelab projects.

Looking forward to reading more about the technology the Community Bridge folks are using :nerd_face: I wonder whether they are using the Sir Perceval and King Arthur components.

germonprez commented 3 years ago

Thanks @sanacl for finding this. A bit buried but there. Is this work that Bitergia is doing? Could there still be attribution to CHAOSS?

alpgarcia commented 3 years ago

@germonprez they are part of CHAOSS.

We included the word Bitergia by convention within the description to identify them when making backups of dashboards. All of them are part of GrimoireLab-sigils project. This way other people could contribute their dashboards in a similar fashion to be able to identify them for their deployments.

At some point, we need to re-think how sigils is structured to make dashboards more accessible, which probably means we will use a different way for identifying "standard" dashboards and give credit to the authors probably via documentation file, because we already have the field, it's a matter of using it in Jekyll: https://github.com/chaoss/grimoirelab-sigils/blob/master/docs/_panels/bugzilla.md.

ShubhraKar commented 3 years ago

Hi everyone, I need to clarify a couple of things. First, the Insights tool is still beta as we started developing a new system entirely for what the LF communities were asking us to do. We moved from a GrimoireLab based service to one we built ourselves. It’s still in active development, so you are seeing bugs in real-time, and the fixes as well. We do plan to open source code from this platform in the future once it’s in a more stable state.

Second, in the transposing of data fields as we migrated our data to the new system, we incorrectly imported the description fields for dashboards. We’ve resolved that here: https://lfanalytics.io/s/lfn-onap/app/kibana#/dashboards?_g=(refreshInterval:(pause:!t,value:0),time:(from:now-15m,to:now))

Please note the link above may be cached if you previously visited it. You may need to use an “incognito” mode or clear your cache to see the update.

When we switched to the current system, our initial communities asked us to keep the same descriptions that went with the visuals. We’re using different code to generate the visuals, but we probably should have revised the descriptions. We’ve added updates to those to our list for the next sprint.

As part of the full lfanalytics.io (insights) stack, we are currently using Perceval to poll raw data from instrumented endpoints and grimoire-elk to enrich elasticsearch documents. We’ve contributed patches to Perceval in the past and we’re happy to give a clearer shout-out in gratitude for the great work you all have done. We’re planning to create a page highlighting all the open source projects we were able to benefit from for the actual release.

We’d also contribute all our changes, however, the changes we made were focused on enabling multi-tenancy (multiple projects sharing the same infrastructure) in the platform, since the original package only scaled for single-tenants. Going forward we may be switching to alternatives for both Perceval and Elk, so the challenge is we would probably not be in a position to maintain those changes long term. We didn’t want to throw out a bunch of changes and then not be there to help long term.

germonprez commented 3 years ago

Hi @ShubhraKar

Thanks so much for the description that you provided here. This is very helpful to me. I'll let others chime in with respect to code contributions to GrimoireLab-related infrastructure components as they will have more insight there.

A clearer shout-out is really appreciated. It gives us a really great way to point to the work that is happening in the CHAOSS project as having an impact in the world :) This really helps.

Thanks again.

alpgarcia commented 3 years ago

@ShubhraKar I guess you mean you imported Sigils dashboards and then modified some stuff here and there and forgot to change the description when saving them. I know what I wrote and what I've created in Kibana or as part of Sigils documentation, and I can see a lot of my work on your dashboards. If you want to use it is totally fine, if you want to re-do the work in Kibana or using any other technology is more than fine. Just please don't use my work and say you are using different visuals. Up to now, you are just using a different version of Kibana. For instance, the Gerrit efficiency dashboard:

screenshot-lfanalytics io-2020 09 17-19_08_39 (1)

GrimoireLab

It will be also great to receive some pull requests in Sigils documentation fixing issues or clarifying things, as I see you wrote the whole documentation too, so I'm sure you found something to improve in the process. For instance:

What you wrote (https://docs.linuxfoundation.org/docs/v/v2/communitybridge/insights/viewing-dashboards/source-control/gerrit#efficiency):

Review Efficiency Index shows a multi-line graph that represents the REI. REI is the number of closed reviews divided by the 
number of open ones in a given period of time. This visualization measures efficiency closing reviews. REI Moving Avg.
(8 weeks) identifies changes in trends. Average is also shown as a reference. REI values greater than 1 mean the community
is closing more reviews than those they are opening. Values smaller than 1 mean the opposite—more reviews open than
those closed during a given time frame. Mouse over this graph or Lead Time to show a line that displays the date and time
at the top of the legend.

What is in Sigils (https://chaoss.github.io/grimoirelab-sigils/panels/gerrit-efficiency/):

REI: Review Efficiency Index, defined as the number of closed changesets divided by the number of open ones in a given
period of time. Measures efficiency closing changesets.
REI is shown next to filtering widget. Moving average is set to 8 weeks to identify changes in trends. Average is also shown
as reference. REI values greater than 1 means the community is closing more changesets than those they are opening. 
Values smaller than 1 means the opposite, i.e., more changesets open than those closed during a given time frame.

A simple reference to the source, a PR with some typos you fixed. Whatever would be enough :+1:

Best,

Alberto.

sgoggins commented 3 years ago

I am a little baffled why this project would not be using the LF sponsored metrics tools already available under the CHAOSS project.

dicortazar commented 3 years ago

That documentation is great, as REI as such does not even exist in the literature :). This comes from a project done together with the OpenStack Foundation years ago, where we used the old Metrics Grimoire technology.

There is an existing metric in the literature called BMI (Backlog Management Index) typically used to measure maintenance efficiency. And REI was a rename by Stefano Maffulli, community manager of OpenStack back in time, to have a proper difference between issues/tickets and code review activity (Gerrit in this example).

@ShubhraKar, this is just a matter of attribution and help each other :). If you are using the dashboards, data models, or any other piece of information, the best we can all do is to work together to advance in the existence of open source tools to analyze open source projects.

As a side not, please double check that GrimoireLab is licensed under GPLv3. This may affect the chosen license once you release Community Bridge as open source.

ShubhraKar commented 3 years ago

@dicortazar @alpgarcia not conflicting what you are saying and indeed as we have said publicly many times we were using grimoirelab packages to bootstrap a proof of concept for a LF central analytics solution and we would be very happy to express gratitude for it when we officially launch. Even our presentations to the TSCs directly link to Chaoss and the metrics specifications.

As part of that, we were asked by the project community to exactly replicate every metric and description from a few Bitergia dashboards. We didn't import siglis or use the code, rather did an export of the view from the kibana UI and created the kibana dashboard from the json. However based on recent feedback from the projects, we are abandoning these efficiency views and moving to a different methodology using machine learning driven anomaly detection. Our documentation is similarly a reflection of what is on the dashboard. Would be more than happy to refer to the source on Siglis, but it isn't a cloned repo, so there isn't a PR to submit.

On similar lines, we are soon abandoning Perceval and grimoire-elk packages and implementing our own agent and enrichment framework as we have hit all sort of scalability issues in a multi-tenant solution serving 360+ projects. We tried to improve perceval significantly and pushed patches upstream as expected, but have hit limits. When we are a bit more stable, we will open source our code base with a permissive license, but we are pretty sure at this time that we won't be using any components of grimoire in near future.

alpgarcia commented 3 years ago

As part of that, we were asked by the project community to exactly replicate every metric and description from a few Bitergia dashboards. We didn't import siglis or use the code, rather did an export of the view from the kibana UI and created the kibana dashboard from the json. However based on recent feedback from the projects, we are abandoning these efficiency views and moving to a different methodology using machine learning driven anomaly detection. Our documentation is similarly a reflection of what is on the dashboard. Would be more than happy to refer to the source on Siglis, but it isn't a cloned repo, so there isn't a PR to submit.

Then you are using Bitergia dashboards. So yes, you are using Sigils work because what you export is the dashboards Bitergia uploaded, no matter what format you use for exporting it. And most of Bitergia dashboards are Sigils ones.

And well, you uploaded all Sigils dashboards available for the data sources you are tracking (look at the left-hand side menu on the above's screenshot), I won't say just a few :).

If you consider the effort the Sigils community put in building all those dashboards, it may be possible that the extra effort you could need to contribute back something to Sigils is affordable for your team.

And let me say I'm not asking for cool dashboards with brand new metrics --it would be great of course :)--, just please if you use Sigils texts to write your own documentation from them, even if you wouldn't use any single word from Sigils (which is not the case), it would be great if you could add some citations and references to the online documentation. This way more people could discover the project. If you read the documentation to write yours, I guess it should be easy to send a couple of PRs to our MDs to suggest updating things or fixing typos.

In summary, as Sigils maintainer, this is a really sad situation for me. We are a small project with a small community, any reference, contribution, participation in our weekly CHAOSS calls are more than welcome. Even if we were only useful for the PoC and then you are going to remove our stuff, other people may be interested in joining the project if they see how the LF is using it.

ShubhraKar commented 3 years ago

@alpgarcia absolutely we will start adding references in all our docs to Siglis. Also I will ask my tech writer to make PRs to your MDs. Our JSONs look wildly different now, but should be doable.

dicortazar commented 3 years ago

Hi @ShubhraKar, thanks for this.

I think this reference will be super useful and valuable for GrimoireLab and CHAOSS as a whole.

And please let us know once LF Analytics is open source, so we can keep helping each other!

germonprez commented 3 years ago

Hi @ShubhraKar.

Thanks so much for the recognition of the CHAOSS work. Very much appreciated.

There were two requested changes:

  1. Grimoire Labs --> GrimoireLab

and

  1. Update the GrimoireLab logo to:

grimoirelab_newlogo

@alpgarcia @sanacl @dicortazar @GeorgLink any other edits?

Thanks again, we really appreciate it.

Matt

GeorgLink commented 3 years ago

No other change requests.

Thanks @ShubhraKar and team!

anajsana commented 3 years ago

Thanks a lot @germonprez !